29
/
en
AIzaSyAYiBZKx7MnpbEhh9jyipgxe19OcubqV5w
April 1, 2024
107963
Colombia
COL
true
2
1
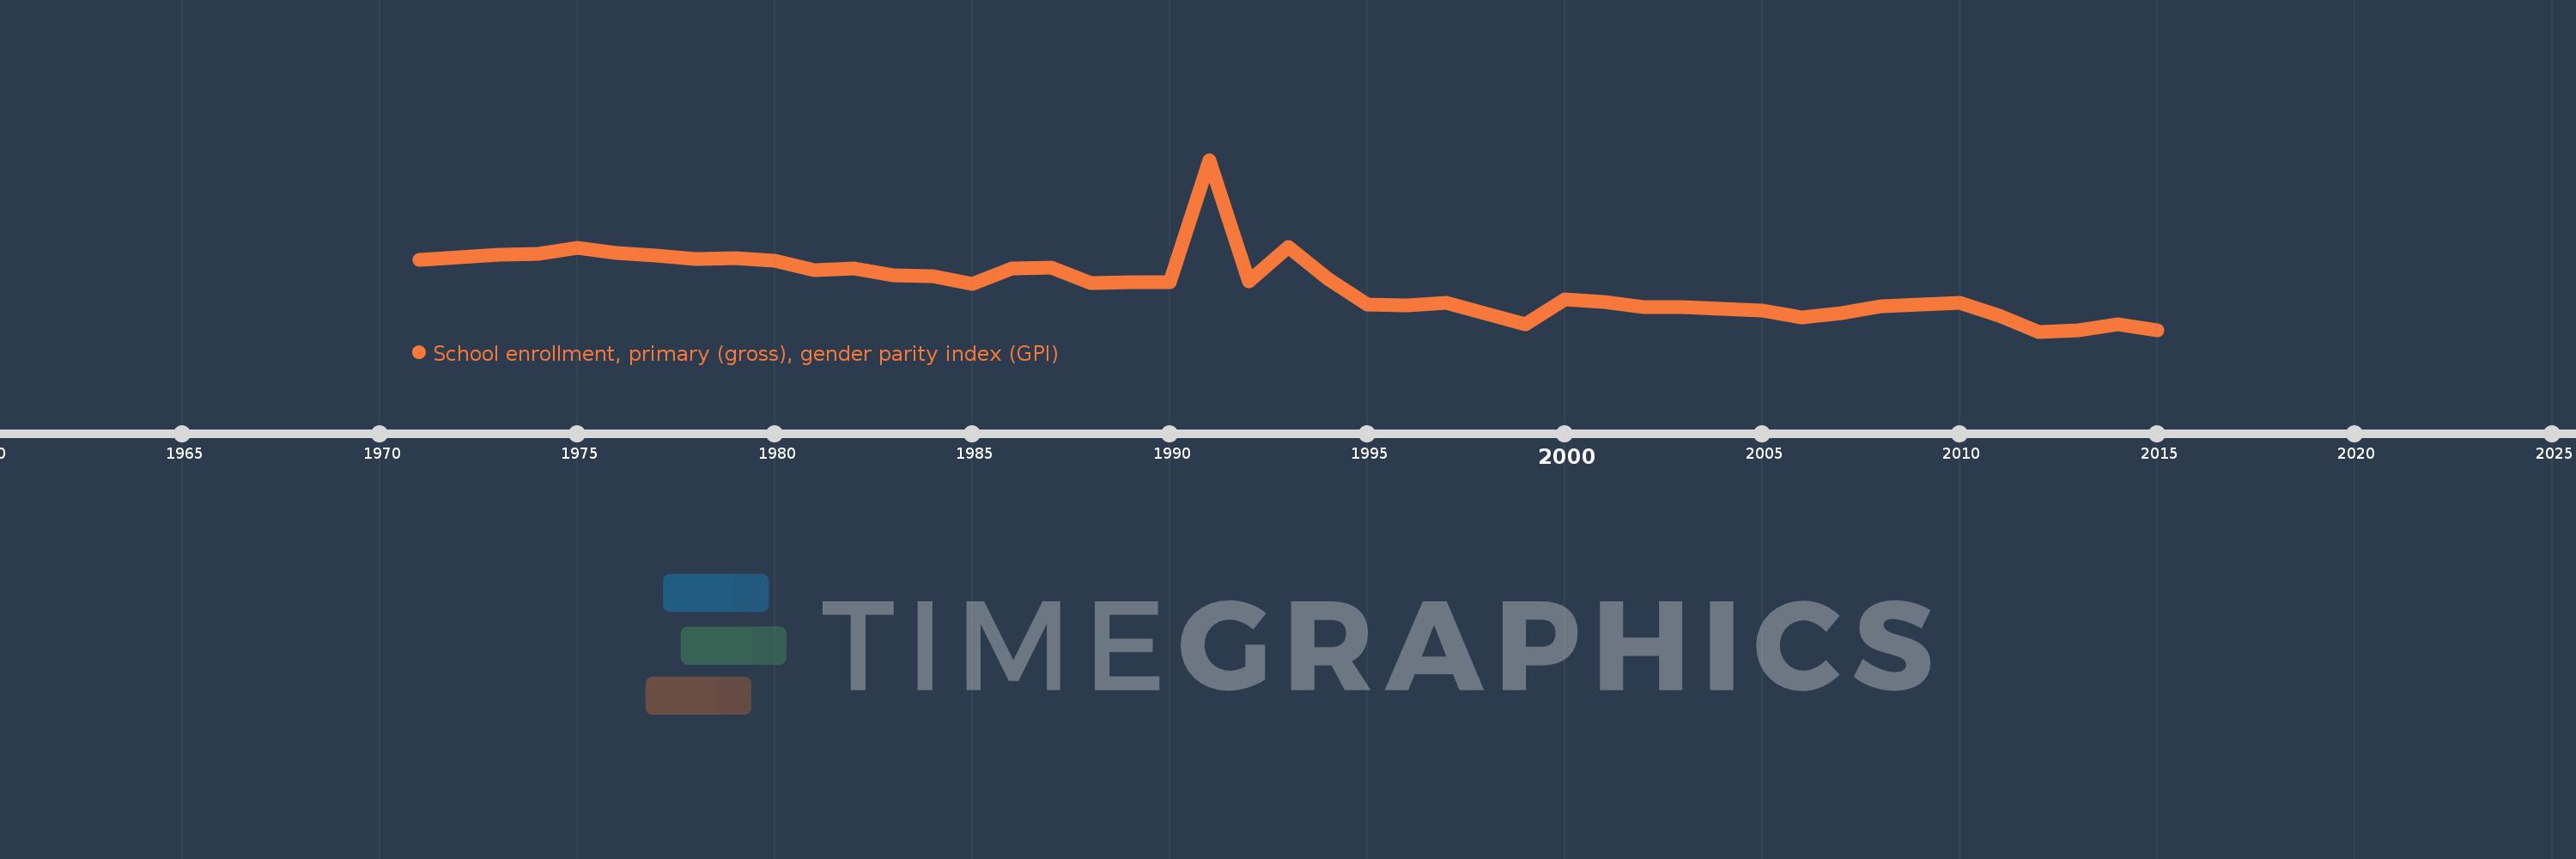
School enrollment, primary (gross), gender parity index (GPI)
2015,2014,2013,2012,2011,2010,2009,2008,2007,2006,2005,2003,2002,2001,2000,1999,1997,1996,1995,1994,1993,1992,1991,1990,1989,1988,1987,1986,1985,1984,1983,1982,1981,1980,1979,1978,1977,1976,1975,1974,1973,1972,1971
This statistics in other country:
AfghanistanAlbaniaAlgeriaAndorraAngolaAntigua and BarbudaArab WorldArgentinaArmeniaArubaAustraliaAustriaAzerbaijanBahamas, TheBahrainBangladeshBarbadosBelarusBelgiumBelizeBeninBermudaBhutanBoliviaBosnia and HerzegovinaBotswanaBrazilBrunei DarussalamBulgariaBurkina FasoBurundiCabo VerdeCambodiaCameroonCanadaCaribbean small statesCentral African RepublicCentral Europe and the BalticsChadChileChinaColombiaComorosCongo, Dem. Rep.Congo, Rep.Costa RicaCote d'IvoireCroatiaCubaCuracaoCyprusCzech RepublicDenmarkDjiboutiDominicaDominican RepublicEarly-demographic dividendEast Asia & PacificEast Asia & Pacific (excluding high income)East Asia & Pacific (IDA & IBRD countries)EcuadorEgypt, Arab Rep.El SalvadorEquatorial GuineaEritreaEstoniaEthiopiaEuro areaEurope & Central AsiaEurope & Central Asia (excluding high income)Europe & Central Asia (IDA & IBRD countries)European UnionFijiFinlandFragile and conflict affected situationsFranceGabonGambia, TheGeorgiaGermanyGhanaGreeceGrenadaGuatemalaGuineaGuinea-BissauGuyanaHaitiHeavily indebted poor countries (HIPC)High incomeHondurasHong Kong SAR, ChinaHungaryIBRD onlyIcelandIDA & IBRD totalIDA blendIDA onlyIDA totalIndiaIndonesiaIran, Islamic Rep.IraqIrelandIsraelItalyJamaicaJapanJordanKazakhstanKenyaKiribatiKorea, Dem. People’s Rep.Korea, Rep.KuwaitKyrgyz RepublicLao PDRLate-demographic dividendLatin America & Caribbean Latin America & Caribbean (excluding high income)Latin America & the Caribbean (IDA & IBRD countries)LatviaLeast developed countries: UN classificationLebanonLesothoLiberiaLibyaLiechtensteinLithuaniaLow & middle incomeLow incomeLower middle incomeLuxembourgMacao SAR, ChinaMacedonia, FYRMadagascarMalawiMaldivesMaliMaltaMarshall IslandsMauritaniaMauritiusMexicoMicronesia, Fed. Sts.Middle East & North AfricaMiddle East & North Africa (excluding high income)Middle East & North Africa (IDA & IBRD countries)Middle incomeMoldovaMongoliaMontenegroMoroccoMozambiqueMyanmarNamibiaNauruNepalNetherlandsNew ZealandNicaraguaNigerNigeriaNorth AmericaNorwayOECD membersOmanOther small statesPacific island small statesPakistanPalauPanamaPapua New GuineaParaguayPeruPhilippinesPolandPortugalPost-demographic dividendPre-demographic dividendPuerto RicoQatarRomaniaRussian FederationRwandaSamoaSan MarinoSao Tome and PrincipeSaudi ArabiaSenegalSerbiaSeychellesSierra LeoneSlovak RepublicSloveniaSmall statesSolomon IslandsSomaliaSouth AfricaSouth AsiaSouth Asia (IDA & IBRD)South SudanSpainSri LankaSt. Kitts and NevisSt. LuciaSt. Vincent and the GrenadinesSub-Saharan Africa Sub-Saharan Africa (excluding high income)Sub-Saharan Africa (IDA & IBRD countries)SudanSurinameSwazilandSwedenSwitzerlandSyrian Arab RepublicTajikistanTanzaniaThailandTimor-LesteTogoTongaTrinidad and TobagoTunisiaTurkeyTurkmenistanTuvaluUgandaUkraineUnited Arab EmiratesUnited KingdomUnited StatesUpper middle incomeUruguayUzbekistanVanuatuVenezuela, RBVietnamWest Bank and GazaWorldYemen, Rep.ZambiaZimbabwe Timeline:
This timeline shows a graph from 1971 to 2015 of Colombia. No data until 1970. Number of actual observations by date: 43.
Source name:
World Development Indicators
Source organization:
United Nations Educational, Scientific, and Cultural Organization (UNESCO) Institute for Statistics.
Categories, topics:
Education, Gender, Social Development
Last updated:
apr 23, 2017
Indicators value changes by year
At the date of observation
Value
Absolute change
Change from previous value
jan 1, 1971
1.042
+1.042
0.0%
jan 1, 1972
1.045
+0.003
0.3%
jan 1, 1973
1.048
+0.002
0.23%
jan 1, 1974
1.049
+0.002
0.15%
jan 1, 1975
1.055
+0.005
0.51%
jan 1, 1976
1.05
-0.004
-0.4%
jan 1, 1977
1.047
-0.004
-0.34%
jan 1, 1978
1.043
-0.004
-0.34%
jan 1, 1979
1.044
+0.0
0.03%
jan 1, 1980
1.041
-0.003
-0.31%
jan 1, 1981
1.031
-0.009
-0.87%
jan 1, 1982
1.033
+0.001
0.1%
jan 1, 1983
1.026
-0.007
-0.64%
jan 1, 1984
1.025
-0.001
-0.05%
jan 1, 1985
1.016
-0.01
-0.96%
jan 1, 1986
1.033
+0.018
1.74%
jan 1, 1987
1.034
+0.001
0.07%
jan 1, 1988
1.017
-0.017
-1.62%
jan 1, 1989
1.018
+0.001
0.07%
jan 1, 1990
1.018
+0.0
0.05%
jan 1, 1991
1.15
+0.131
12.91%
jan 1, 1992
1.019
-0.131
-11.38%
jan 1, 1993
1.056
+0.037
3.63%
jan 1, 1994
1.022
-0.034
-3.18%
jan 1, 1995
0.994
-0.028
-2.77%
jan 1, 1996
0.993
-0.001
-0.09%
jan 1, 1997
0.996
+0.003
0.33%
jan 1, 1999
0.973
-0.023
-2.3%
jan 1, 2000
1.0
+0.027
2.77%
jan 1, 2001
0.997
-0.004
-0.36%
jan 1, 2002
0.991
-0.006
-0.61%
jan 1, 2003
0.991
+0.0
0.02%
jan 1, 2005
0.988
-0.003
-0.33%
jan 1, 2006
0.98
-0.007
-0.73%
jan 1, 2007
0.985
+0.005
0.5%
jan 1, 2008
0.992
+0.006
0.65%
jan 1, 2009
0.994
+0.003
0.28%
jan 1, 2010
0.996
+0.001
0.13%
jan 1, 2011
0.982
-0.014
-1.41%
jan 1, 2012
0.965
-0.016
-1.67%
jan 1, 2013
0.966
+0.001
0.08%
jan 1, 2014
0.973
+0.007
0.7%
jan 1, 2015
0.966
-0.007
-0.69%
Ranking of countries by current statistics by years


Comments: