29
/
en
AIzaSyAYiBZKx7MnpbEhh9jyipgxe19OcubqV5w
April 1, 2024
174770
Lao PDR
LAO
true
2
1
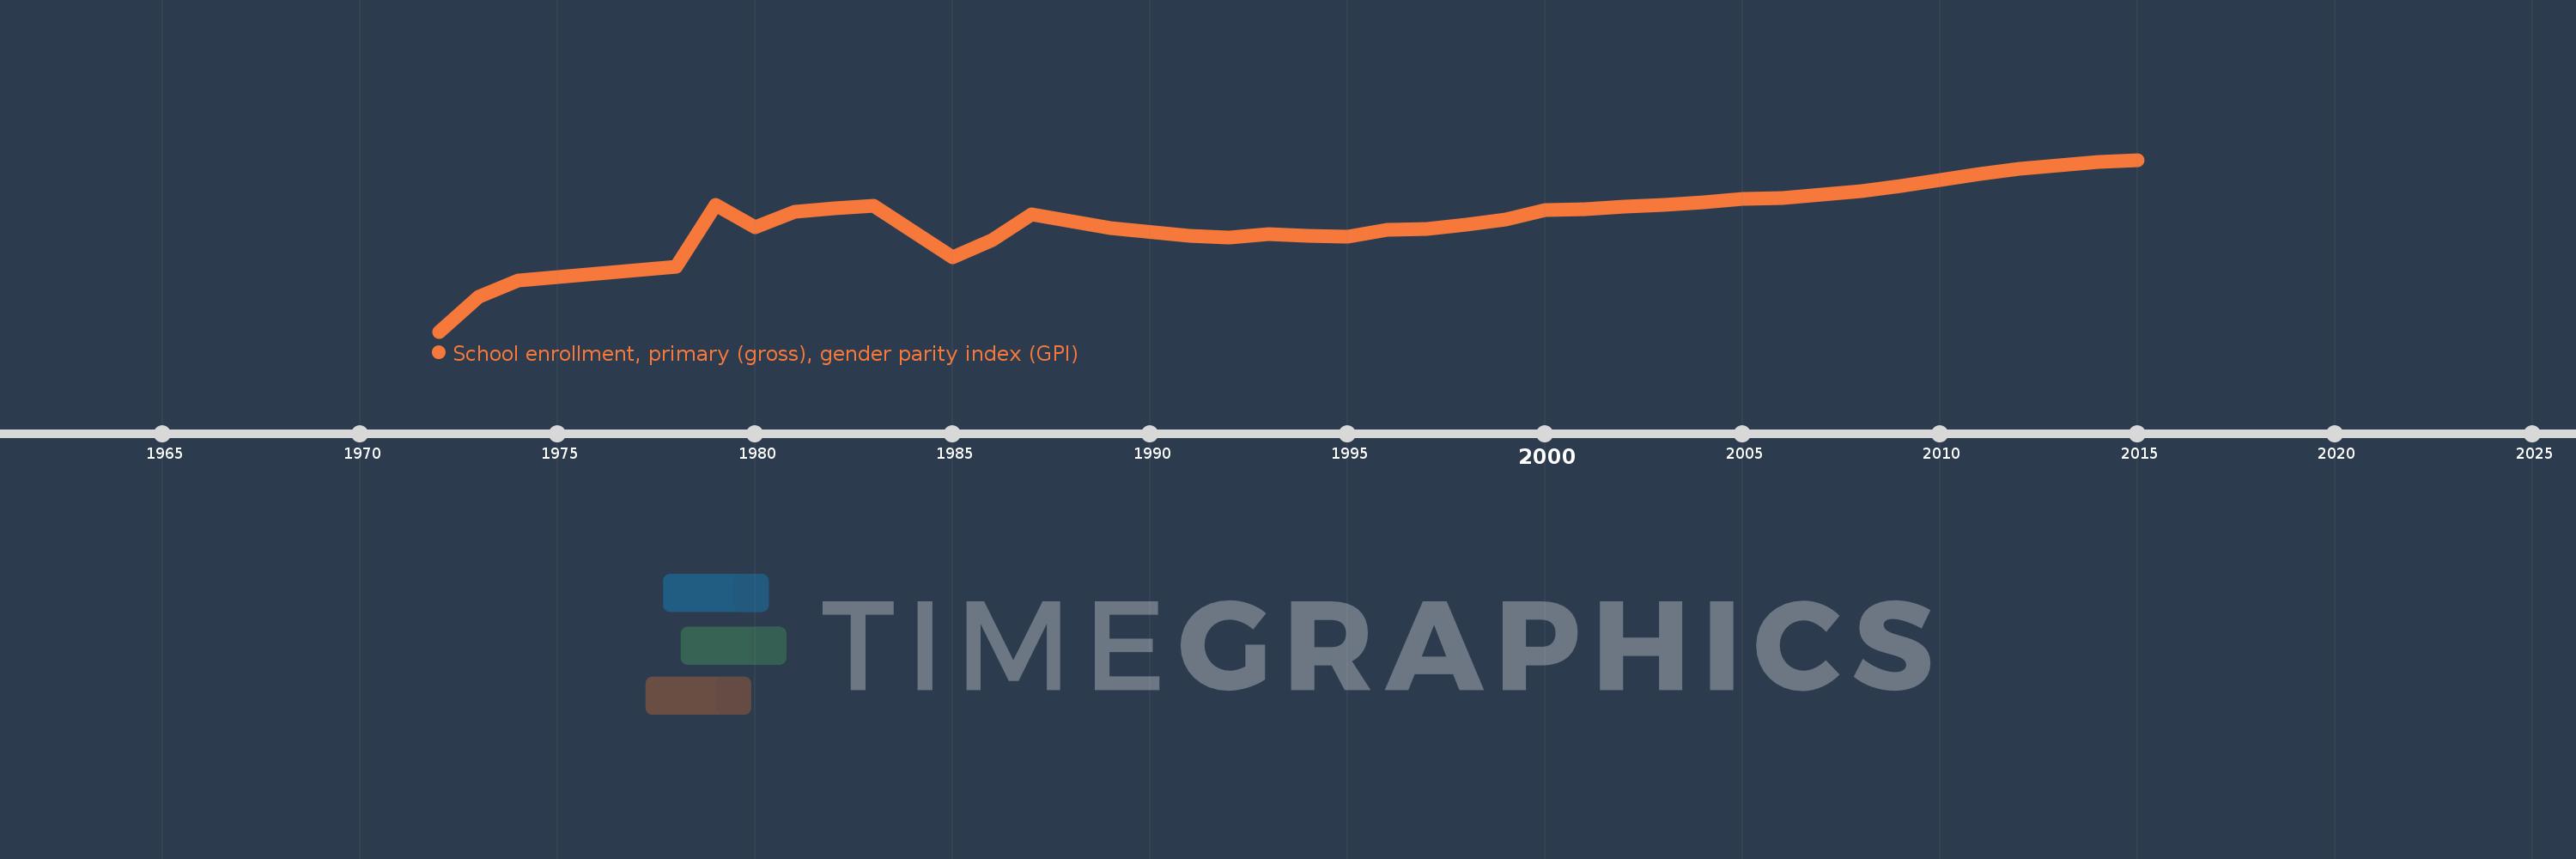
School enrollment, primary (gross), gender parity index (GPI)
2015,2014,2013,2012,2011,2010,2009,2008,2007,2006,2005,2004,2003,2002,2001,2000,1999,1998,1997,1996,1995,1994,1993,1992,1991,1989,1987,1986,1985,1983,1982,1981,1980,1979,1978,1974,1973,1972
This statistics in other country:
AfghanistanAlbaniaAlgeriaAndorraAngolaAntigua and BarbudaArab WorldArgentinaArmeniaArubaAustraliaAustriaAzerbaijanBahamas, TheBahrainBangladeshBarbadosBelarusBelgiumBelizeBeninBermudaBhutanBoliviaBosnia and HerzegovinaBotswanaBrazilBrunei DarussalamBulgariaBurkina FasoBurundiCabo VerdeCambodiaCameroonCanadaCaribbean small statesCentral African RepublicCentral Europe and the BalticsChadChileChinaColombiaComorosCongo, Dem. Rep.Congo, Rep.Costa RicaCote d'IvoireCroatiaCubaCuracaoCyprusCzech RepublicDenmarkDjiboutiDominicaDominican RepublicEarly-demographic dividendEast Asia & PacificEast Asia & Pacific (excluding high income)East Asia & Pacific (IDA & IBRD countries)EcuadorEgypt, Arab Rep.El SalvadorEquatorial GuineaEritreaEstoniaEthiopiaEuro areaEurope & Central AsiaEurope & Central Asia (excluding high income)Europe & Central Asia (IDA & IBRD countries)European UnionFijiFinlandFragile and conflict affected situationsFranceGabonGambia, TheGeorgiaGermanyGhanaGreeceGrenadaGuatemalaGuineaGuinea-BissauGuyanaHaitiHeavily indebted poor countries (HIPC)High incomeHondurasHong Kong SAR, ChinaHungaryIBRD onlyIcelandIDA & IBRD totalIDA blendIDA onlyIDA totalIndiaIndonesiaIran, Islamic Rep.IraqIrelandIsraelItalyJamaicaJapanJordanKazakhstanKenyaKiribatiKorea, Dem. People’s Rep.Korea, Rep.KuwaitKyrgyz RepublicLao PDRLate-demographic dividendLatin America & Caribbean Latin America & Caribbean (excluding high income)Latin America & the Caribbean (IDA & IBRD countries)LatviaLeast developed countries: UN classificationLebanonLesothoLiberiaLibyaLiechtensteinLithuaniaLow & middle incomeLow incomeLower middle incomeLuxembourgMacao SAR, ChinaMacedonia, FYRMadagascarMalawiMaldivesMaliMaltaMarshall IslandsMauritaniaMauritiusMexicoMicronesia, Fed. Sts.Middle East & North AfricaMiddle East & North Africa (excluding high income)Middle East & North Africa (IDA & IBRD countries)Middle incomeMoldovaMongoliaMontenegroMoroccoMozambiqueMyanmarNamibiaNauruNepalNetherlandsNew ZealandNicaraguaNigerNigeriaNorth AmericaNorwayOECD membersOmanOther small statesPacific island small statesPakistanPalauPanamaPapua New GuineaParaguayPeruPhilippinesPolandPortugalPost-demographic dividendPre-demographic dividendPuerto RicoQatarRomaniaRussian FederationRwandaSamoaSan MarinoSao Tome and PrincipeSaudi ArabiaSenegalSerbiaSeychellesSierra LeoneSlovak RepublicSloveniaSmall statesSolomon IslandsSomaliaSouth AfricaSouth AsiaSouth Asia (IDA & IBRD)South SudanSpainSri LankaSt. Kitts and NevisSt. LuciaSt. Vincent and the GrenadinesSub-Saharan Africa Sub-Saharan Africa (excluding high income)Sub-Saharan Africa (IDA & IBRD countries)SudanSurinameSwazilandSwedenSwitzerlandSyrian Arab RepublicTajikistanTanzaniaThailandTimor-LesteTogoTongaTrinidad and TobagoTunisiaTurkeyTurkmenistanTuvaluUgandaUkraineUnited Arab EmiratesUnited KingdomUnited StatesUpper middle incomeUruguayUzbekistanVanuatuVenezuela, RBVietnamWest Bank and GazaWorldYemen, Rep.ZambiaZimbabwe Timeline:
This timeline shows a graph from 1972 to 2015 of Lao PDR. No data until 1971. Number of actual observations by date: 38.
Source name:
World Development Indicators
Source organization:
United Nations Educational, Scientific, and Cultural Organization (UNESCO) Institute for Statistics.
Categories, topics:
Education, Gender, Social Development
Last updated:
apr 23, 2017
Indicators value changes by year
At the date of observation
Value
Absolute change
Change from previous value
jan 1, 1972
0.595
+0.595
0.0%
jan 1, 1973
0.668
+0.073
12.24%
jan 1, 1974
0.701
+0.033
4.89%
jan 1, 1978
0.73
+0.029
4.14%
jan 1, 1979
0.859
+0.13
17.76%
jan 1, 1980
0.812
-0.047
-5.45%
jan 1, 1981
0.845
+0.033
4.07%
jan 1, 1982
0.852
+0.006
0.75%
jan 1, 1983
0.858
+0.006
0.75%
jan 1, 1985
0.75
-0.108
-12.54%
jan 1, 1986
0.786
+0.035
4.72%
jan 1, 1987
0.839
+0.053
6.78%
jan 1, 1989
0.81
-0.029
-3.48%
jan 1, 1991
0.794
-0.016
-1.92%
jan 1, 1992
0.791
-0.003
-0.38%
jan 1, 1993
0.798
+0.007
0.86%
jan 1, 1994
0.794
-0.004
-0.49%
jan 1, 1995
0.792
-0.003
-0.34%
jan 1, 1996
0.807
+0.015
1.91%
jan 1, 1997
0.809
+0.003
0.33%
jan 1, 1998
0.818
+0.009
1.09%
jan 1, 1999
0.828
+0.01
1.19%
jan 1, 2000
0.848
+0.02
2.36%
jan 1, 2001
0.85
+0.003
0.3%
jan 1, 2002
0.856
+0.006
0.65%
jan 1, 2003
0.859
+0.003
0.39%
jan 1, 2004
0.864
+0.005
0.59%
jan 1, 2005
0.872
+0.008
0.98%
jan 1, 2006
0.874
+0.002
0.22%
jan 1, 2007
0.88
+0.005
0.61%
jan 1, 2008
0.888
+0.009
1.0%
jan 1, 2009
0.899
+0.01
1.16%
jan 1, 2010
0.911
+0.013
1.41%
jan 1, 2011
0.923
+0.011
1.24%
jan 1, 2012
0.934
+0.012
1.25%
jan 1, 2013
0.942
+0.008
0.84%
jan 1, 2014
0.948
+0.006
0.62%
jan 1, 2015
0.953
+0.005
0.55%
Ranking of countries by current statistics by years


Comments: