29
/
en
AIzaSyAYiBZKx7MnpbEhh9jyipgxe19OcubqV5w
April 1, 2024
251941
St. Vincent and the Grenadines
VCT
true
2
1
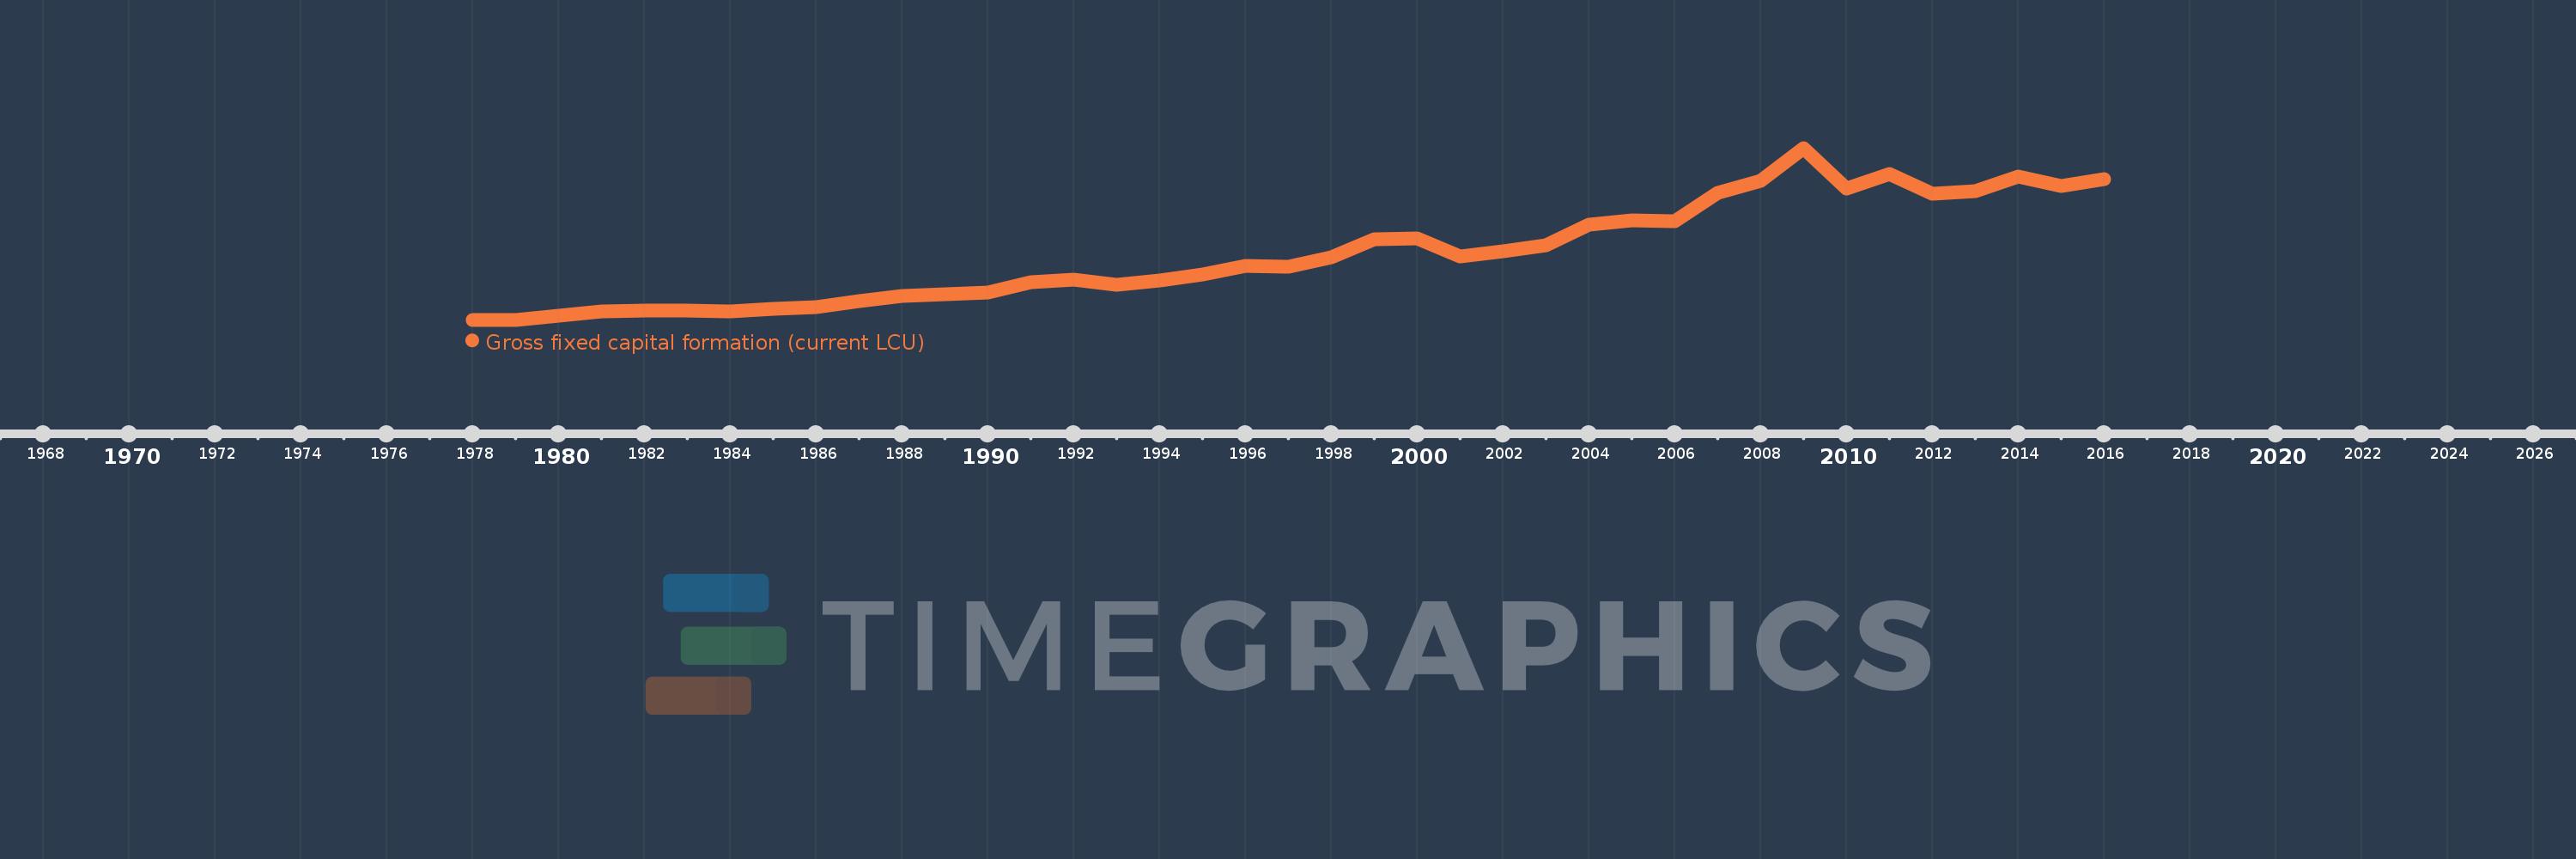
Gross fixed capital formation (current LCU)
2016,2015,2014,2013,2012,2011,2010,2009,2008,2007,2006,2005,2004,2003,2002,2001,2000,1999,1998,1997,1996,1995,1994,1993,1992,1991,1990,1989,1988,1987,1986,1985,1984,1983,1982,1981,1980,1979,1978
This statistics in other country:
AfghanistanAlbaniaAlgeriaAngolaAntigua and BarbudaArgentinaArmeniaArubaAustraliaAustriaAzerbaijanBahamas, TheBahrainBangladeshBarbadosBelarusBelgiumBelizeBeninBermudaBhutanBoliviaBosnia and HerzegovinaBotswanaBrazilBrunei DarussalamBulgariaBurkina FasoBurundiCabo VerdeCambodiaCameroonCanadaCentral African RepublicChadChileChinaColombiaComorosCongo, Dem. Rep.Congo, Rep.Costa RicaCote d'IvoireCroatiaCubaCyprusCzech RepublicDenmarkDjiboutiDominicaDominican RepublicEcuadorEgypt, Arab Rep.El SalvadorEquatorial GuineaEritreaEstoniaEthiopiaFijiFinlandFranceGabonGambia, TheGeorgiaGermanyGhanaGreeceGrenadaGuatemalaGuineaGuinea-BissauGuyanaHaitiHondurasHong Kong SAR, ChinaHungaryIcelandIndiaIndonesiaIran, Islamic Rep.IraqIrelandIsraelItalyJamaicaJapanJordanKazakhstanKenyaKiribatiKorea, Rep.KosovoKuwaitKyrgyz RepublicLao PDRLatviaLebanonLesothoLiberiaLibyaLithuaniaLuxembourgMacao SAR, ChinaMacedonia, FYRMadagascarMalawiMalaysiaMaldivesMaliMaltaMauritaniaMauritiusMexicoMicronesia, Fed. Sts.MoldovaMongoliaMontenegroMoroccoMozambiqueNamibiaNepalNetherlandsNew CaledoniaNew ZealandNicaraguaNigerNigeriaNorwayOmanPakistanPanamaPapua New GuineaParaguayPeruPhilippinesPolandPortugalPuerto RicoRomaniaRussian FederationRwandaSaudi ArabiaSenegalSerbiaSeychellesSierra LeoneSingaporeSlovak RepublicSloveniaSolomon IslandsSomaliaSouth AfricaSouth SudanSpainSri LankaSt. Kitts and NevisSt. LuciaSt. Vincent and the GrenadinesSudanSurinameSwazilandSwedenSwitzerlandSyrian Arab RepublicTajikistanTanzaniaThailandTimor-LesteTogoTongaTrinidad and TobagoTunisiaTurkeyTurkmenistanUgandaUkraineUnited Arab EmiratesUnited KingdomUnited StatesUruguayUzbekistanVanuatuVenezuela, RBVietnamWest Bank and GazaYemen, Rep.ZambiaZimbabwe Timeline:
This timeline shows a graph from 1978 to 2016 of St. Vincent and the Grenadines. No data until 1977. Number of actual observations by date: 39.
Source name:
World Development Indicators
Source organization:
World Bank national accounts data, and OECD National Accounts data files.
Categories, topics:
Economy & Growth
Last updated:
apr 23, 2017
Indicators value changes by year
Minimum:
33.88 mln
jan 1, 1978
Maximum:
622.407 mln
jan 1, 2009
At the date of observation
Value
Absolute change
Change from previous value
jan 1, 1978
33.88 mln
+33.88 mln
0.0%
jan 1, 1979
34.37 mln
+490.0K
1.45%
jan 1, 1980
48.62 mln
+14.25 mln
41.46%
jan 1, 1981
63.079 mln
+14.459 mln
29.74%
jan 1, 1982
64.397 mln
+1.318 mln
2.09%
jan 1, 1983
65.258 mln
+861.6K
1.34%
jan 1, 1984
63.363 mln
-1.895 mln
-2.9%
jan 1, 1985
71.076 mln
+7.714 mln
12.17%
jan 1, 1986
76.621 mln
+5.545 mln
7.8%
jan 1, 1987
98.749 mln
+22.128 mln
28.88%
jan 1, 1988
115.656 mln
+16.907 mln
17.12%
jan 1, 1989
122.113 mln
+6.457 mln
5.58%
jan 1, 1990
127.212 mln
+5.099 mln
4.18%
jan 1, 1991
161.239 mln
+34.028 mln
26.75%
jan 1, 1992
171.224 mln
+9.984 mln
6.19%
jan 1, 1993
154.854 mln
-16.37 mln
-9.56%
jan 1, 1994
167.565 mln
+12.711 mln
8.21%
jan 1, 1995
187.929 mln
+20.364 mln
12.15%
jan 1, 1996
218.378 mln
+30.45 mln
16.2%
jan 1, 1997
215.702 mln
-2.676 mln
-1.23%
jan 1, 1998
247.155 mln
+31.453 mln
14.58%
jan 1, 1999
310.376 mln
+63.221 mln
25.58%
jan 1, 2000
312.586 mln
+2.21 mln
0.71%
jan 1, 2001
250.46 mln
-62.126 mln
-19.87%
jan 1, 2002
268.86 mln
+18.4 mln
7.35%
jan 1, 2003
289.89 mln
+21.03 mln
7.82%
jan 1, 2004
359.04 mln
+69.15 mln
23.85%
jan 1, 2005
374.59 mln
+15.55 mln
4.33%
jan 1, 2006
372.85 mln
-1.74 mln
-0.46%
jan 1, 2007
469.56 mln
+96.71 mln
25.94%
jan 1, 2008
509.913 mln
+40.353 mln
8.59%
jan 1, 2009
622.407 mln
+112.494 mln
22.06%
jan 1, 2010
482.928 mln
-139.479 mln
-22.41%
jan 1, 2011
533.179 mln
+50.251 mln
10.41%
jan 1, 2012
464.315 mln
-68.863 mln
-12.92%
jan 1, 2013
475.727 mln
+11.412 mln
2.46%
jan 1, 2014
523.795 mln
+48.068 mln
10.1%
jan 1, 2015
491.178 mln
-32.617 mln
-6.23%
jan 1, 2016
516.59 mln
+25.412 mln
5.17%
Ranking of countries by current statistics by years


Comments: