29
/
en
AIzaSyAYiBZKx7MnpbEhh9jyipgxe19OcubqV5w
April 1, 2024
219633
Papua New Guinea
PNG
true
2
1
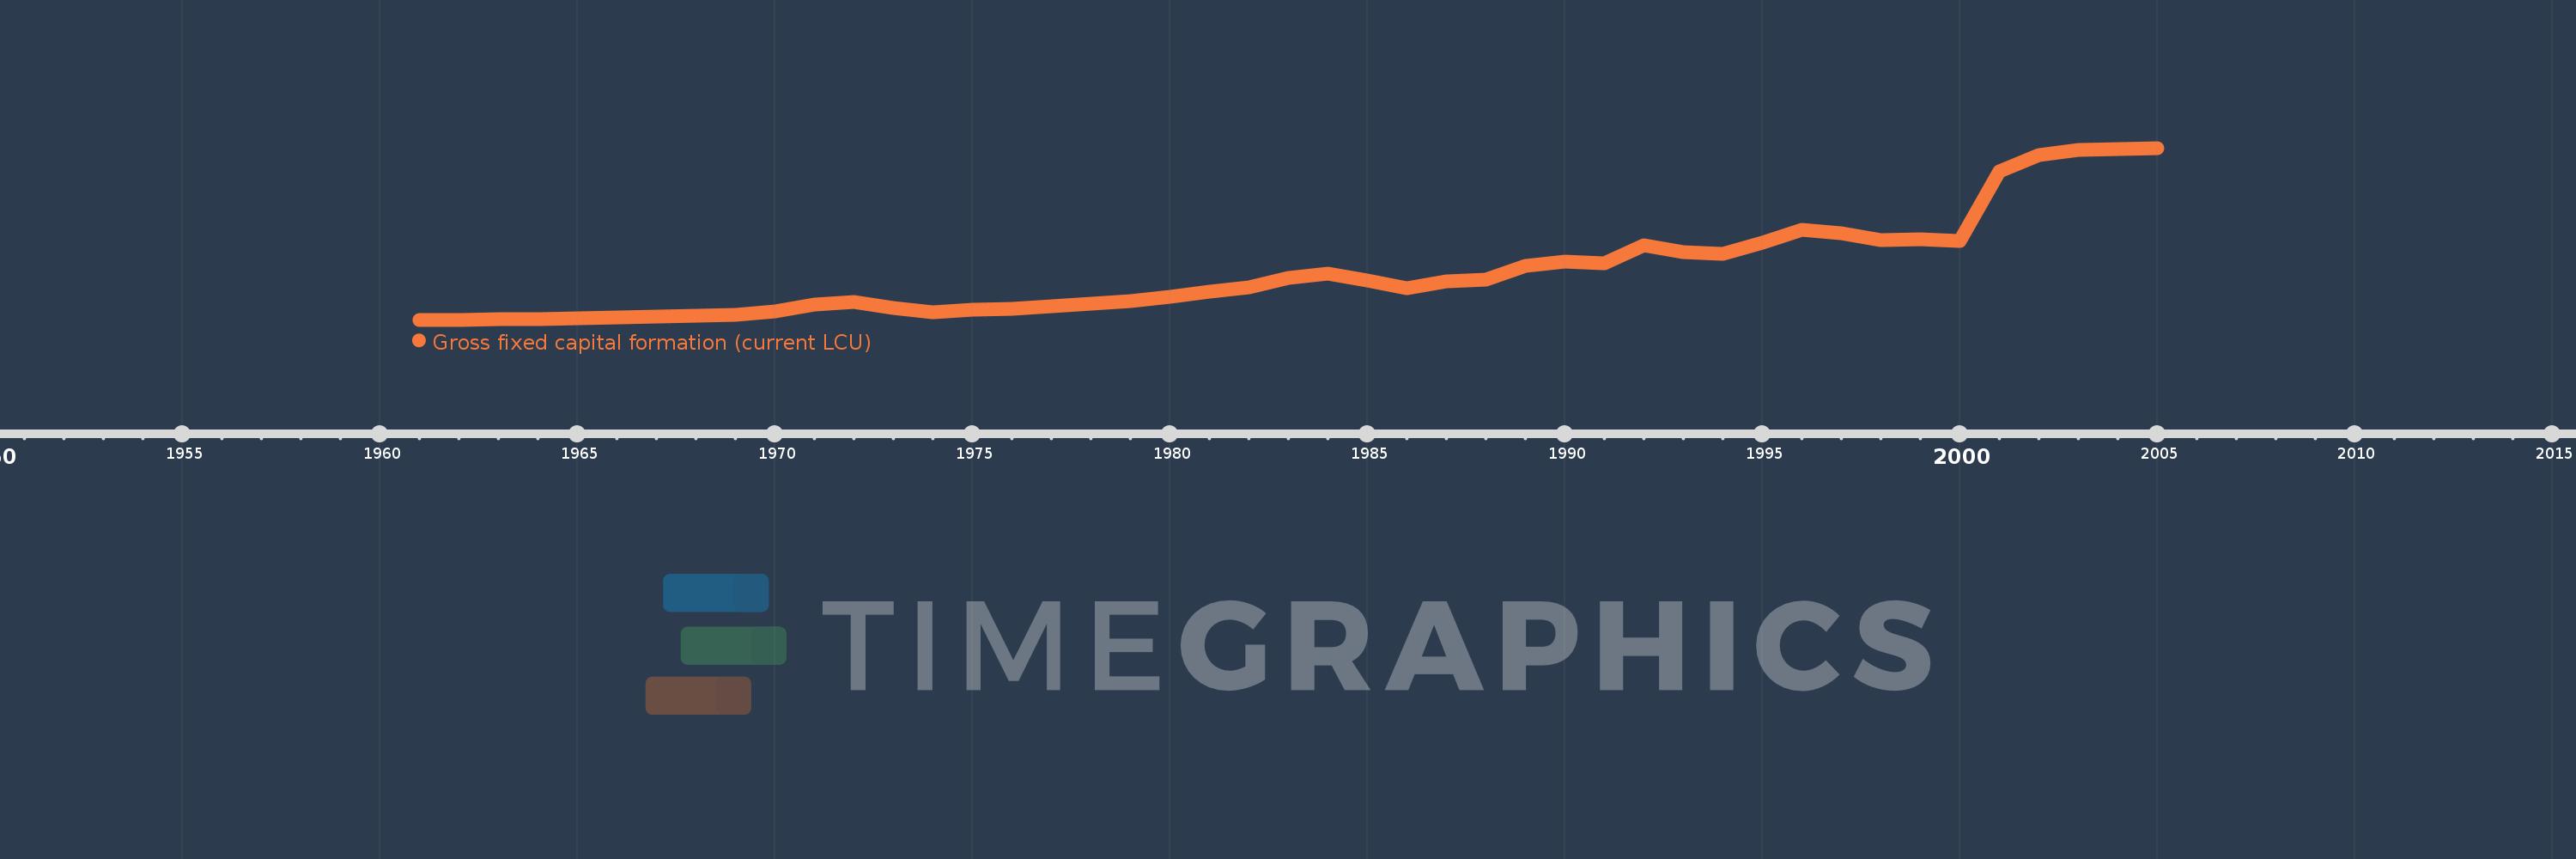
Gross fixed capital formation (current LCU)
2005,2004,2003,2002,2001,2000,1999,1998,1997,1996,1995,1994,1993,1992,1991,1990,1989,1988,1987,1986,1985,1984,1983,1982,1981,1980,1979,1978,1977,1976,1975,1974,1973,1972,1971,1970,1969,1968,1967,1966,1965,1964,1963,1962,1961
This statistics in other country:
AfghanistanAlbaniaAlgeriaAngolaAntigua and BarbudaArgentinaArmeniaArubaAustraliaAustriaAzerbaijanBahamas, TheBahrainBangladeshBarbadosBelarusBelgiumBelizeBeninBermudaBhutanBoliviaBosnia and HerzegovinaBotswanaBrazilBrunei DarussalamBulgariaBurkina FasoBurundiCabo VerdeCambodiaCameroonCanadaCentral African RepublicChadChileChinaColombiaComorosCongo, Dem. Rep.Congo, Rep.Costa RicaCote d'IvoireCroatiaCubaCyprusCzech RepublicDenmarkDjiboutiDominicaDominican RepublicEcuadorEgypt, Arab Rep.El SalvadorEquatorial GuineaEritreaEstoniaEthiopiaFijiFinlandFranceGabonGambia, TheGeorgiaGermanyGhanaGreeceGrenadaGuatemalaGuineaGuinea-BissauGuyanaHaitiHondurasHong Kong SAR, ChinaHungaryIcelandIndiaIndonesiaIran, Islamic Rep.IraqIrelandIsraelItalyJamaicaJapanJordanKazakhstanKenyaKiribatiKorea, Rep.KosovoKuwaitKyrgyz RepublicLao PDRLatviaLebanonLesothoLiberiaLibyaLithuaniaLuxembourgMacao SAR, ChinaMacedonia, FYRMadagascarMalawiMalaysiaMaldivesMaliMaltaMauritaniaMauritiusMexicoMicronesia, Fed. Sts.MoldovaMongoliaMontenegroMoroccoMozambiqueNamibiaNepalNetherlandsNew CaledoniaNew ZealandNicaraguaNigerNigeriaNorwayOmanPakistanPanamaPapua New GuineaParaguayPeruPhilippinesPolandPortugalPuerto RicoRomaniaRussian FederationRwandaSaudi ArabiaSenegalSerbiaSeychellesSierra LeoneSingaporeSlovak RepublicSloveniaSolomon IslandsSomaliaSouth AfricaSouth SudanSpainSri LankaSt. Kitts and NevisSt. LuciaSt. Vincent and the GrenadinesSudanSurinameSwazilandSwedenSwitzerlandSyrian Arab RepublicTajikistanTanzaniaThailandTimor-LesteTogoTongaTrinidad and TobagoTunisiaTurkeyTurkmenistanUgandaUkraineUnited Arab EmiratesUnited KingdomUnited StatesUruguayUzbekistanVanuatuVenezuela, RBVietnamWest Bank and GazaYemen, Rep.ZambiaZimbabwe Timeline:
This timeline shows a graph from 1961 to 2005 of Papua New Guinea. No data until 1960. Number of actual observations by date: 45.
Source name:
World Development Indicators
Source organization:
World Bank national accounts data, and OECD National Accounts data files.
Categories, topics:
Economy & Growth
Last updated:
apr 23, 2017
Indicators value changes by year
Minimum:
27.4 mln
jan 1, 1962
Maximum:
2.294 bln
jan 1, 2005
At the date of observation
Value
Absolute change
Change from previous value
jan 1, 1961
27.6 mln
+27.6 mln
0.0%
jan 1, 1962
27.4 mln
-200.0K
-0.72%
jan 1, 1963
30.7 mln
+3.3 mln
12.04%
jan 1, 1964
37.8 mln
+7.1 mln
23.13%
jan 1, 1965
46.5 mln
+8.7 mln
23.02%
jan 1, 1966
58.4 mln
+11.9 mln
25.59%
jan 1, 1967
72.6 mln
+14.2 mln
24.32%
jan 1, 1968
81.1 mln
+8.5 mln
11.71%
jan 1, 1969
87.3 mln
+6.2 mln
7.64%
jan 1, 1970
136.9 mln
+49.6 mln
56.82%
jan 1, 1971
229.3 mln
+92.4 mln
67.49%
jan 1, 1972
258.9 mln
+29.6 mln
12.91%
jan 1, 1973
185.8 mln
-73.1 mln
-28.23%
jan 1, 1974
130.2 mln
-55.6 mln
-29.92%
jan 1, 1975
158.5 mln
+28.3 mln
21.74%
jan 1, 1976
175.0 mln
+16.5 mln
10.41%
jan 1, 1977
200.6 mln
+25.6 mln
14.63%
jan 1, 1978
239.3 mln
+38.7 mln
19.29%
jan 1, 1979
268.5 mln
+29.2 mln
12.2%
jan 1, 1980
326.2 mln
+57.7 mln
21.49%
jan 1, 1981
394.2 mln
+68.0 mln
20.85%
jan 1, 1982
450.7 mln
+56.5 mln
14.33%
jan 1, 1983
576.7 mln
+126.0 mln
27.96%
jan 1, 1984
636.9 mln
+60.2 mln
10.44%
jan 1, 1985
547.7 mln
-89.2 mln
-14.01%
jan 1, 1986
446.9 mln
-100.8 mln
-18.4%
jan 1, 1987
539.2 mln
+92.3 mln
20.65%
jan 1, 1988
551.2 mln
+12.0 mln
2.23%
jan 1, 1989
737.0 mln
+185.8 mln
33.71%
jan 1, 1990
790.7 mln
+53.7 mln
7.29%
jan 1, 1991
772.9 mln
-17.8 mln
-2.25%
jan 1, 1992
1.01 bln
+237.2 mln
30.69%
jan 1, 1993
914.1 mln
-96.0 mln
-9.5%
jan 1, 1994
900.8 mln
-13.3 mln
-1.45%
jan 1, 1995
1.04 bln
+139.135 mln
15.45%
jan 1, 1996
1.21 bln
+170.232 mln
16.37%
jan 1, 1997
1.171 bln
-39.477 mln
-3.26%
jan 1, 1998
1.082 bln
-88.897 mln
-7.59%
jan 1, 1999
1.091 bln
+8.912 mln
0.82%
jan 1, 2000
1.068 bln
-22.287 mln
-2.04%
jan 1, 2001
1.988 bln
+919.281 mln
86.04%
jan 1, 2002
2.2 bln
+212.139 mln
10.67%
jan 1, 2003
2.264 bln
+64.056 mln
2.91%
jan 1, 2004
2.281 bln
+17.324 mln
0.77%
jan 1, 2005
2.294 bln
+13.077 mln
0.57%
Ranking of countries by current statistics by years


Comments: