29
/
en
AIzaSyAYiBZKx7MnpbEhh9jyipgxe19OcubqV5w
April 1, 2024
109733
Congo, Dem. Rep.
COD
true
2
1
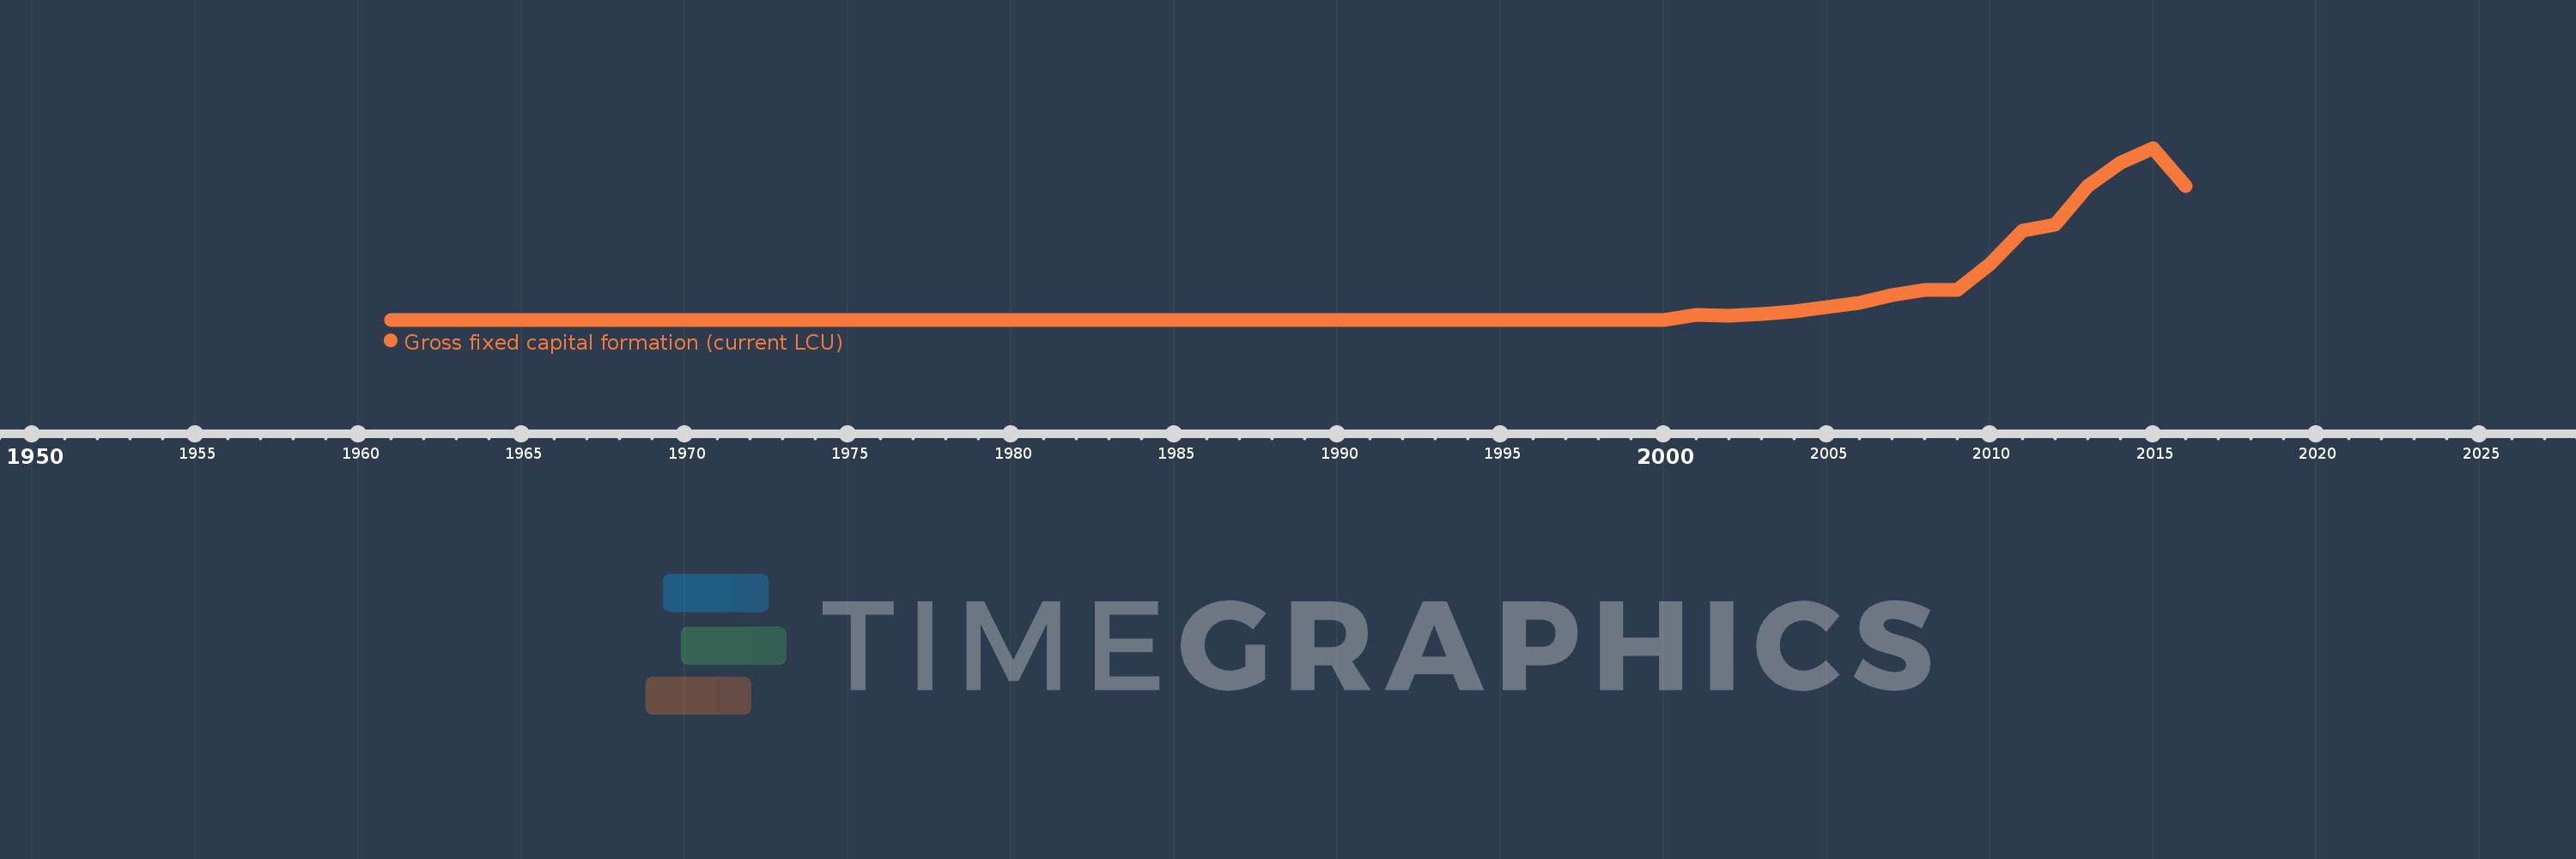
Gross fixed capital formation (current LCU)
2016,2015,2014,2013,2012,2011,2010,2009,2008,2007,2006,2005,2004,2003,2002,2001,2000,1999,1998,1997,1996,1995,1994,1993,1992,1991,1990,1989,1988,1987,1986,1985,1984,1983,1982,1981,1980,1979,1978,1977,1976,1975,1974,1973,1972,1971,1970,1969,1968,1967,1966,1965,1964,1963,1962,1961
This statistics in other country:
AfghanistanAlbaniaAlgeriaAngolaAntigua and BarbudaArgentinaArmeniaArubaAustraliaAustriaAzerbaijanBahamas, TheBahrainBangladeshBarbadosBelarusBelgiumBelizeBeninBermudaBhutanBoliviaBosnia and HerzegovinaBotswanaBrazilBrunei DarussalamBulgariaBurkina FasoBurundiCabo VerdeCambodiaCameroonCanadaCentral African RepublicChadChileChinaColombiaComorosCongo, Dem. Rep.Congo, Rep.Costa RicaCote d'IvoireCroatiaCubaCyprusCzech RepublicDenmarkDjiboutiDominicaDominican RepublicEcuadorEgypt, Arab Rep.El SalvadorEquatorial GuineaEritreaEstoniaEthiopiaFijiFinlandFranceGabonGambia, TheGeorgiaGermanyGhanaGreeceGrenadaGuatemalaGuineaGuinea-BissauGuyanaHaitiHondurasHong Kong SAR, ChinaHungaryIcelandIndiaIndonesiaIran, Islamic Rep.IraqIrelandIsraelItalyJamaicaJapanJordanKazakhstanKenyaKiribatiKorea, Rep.KosovoKuwaitKyrgyz RepublicLao PDRLatviaLebanonLesothoLiberiaLibyaLithuaniaLuxembourgMacao SAR, ChinaMacedonia, FYRMadagascarMalawiMalaysiaMaldivesMaliMaltaMauritaniaMauritiusMexicoMicronesia, Fed. Sts.MoldovaMongoliaMontenegroMoroccoMozambiqueNamibiaNepalNetherlandsNew CaledoniaNew ZealandNicaraguaNigerNigeriaNorwayOmanPakistanPanamaPapua New GuineaParaguayPeruPhilippinesPolandPortugalPuerto RicoRomaniaRussian FederationRwandaSaudi ArabiaSenegalSerbiaSeychellesSierra LeoneSingaporeSlovak RepublicSloveniaSolomon IslandsSomaliaSouth AfricaSouth SudanSpainSri LankaSt. Kitts and NevisSt. LuciaSt. Vincent and the GrenadinesSudanSurinameSwazilandSwedenSwitzerlandSyrian Arab RepublicTajikistanTanzaniaThailandTimor-LesteTogoTongaTrinidad and TobagoTunisiaTurkeyTurkmenistanUgandaUkraineUnited Arab EmiratesUnited KingdomUnited StatesUruguayUzbekistanVanuatuVenezuela, RBVietnamWest Bank and GazaYemen, Rep.ZambiaZimbabwe Timeline:
This timeline shows a graph from 1961 to 2016 of Congo, Dem. Rep.. No data until 1960. Number of actual observations by date: 56.
Source name:
World Development Indicators
Source organization:
World Bank national accounts data, and OECD National Accounts data files.
Categories, topics:
Economy & Growth
Last updated:
apr 23, 2017
Indicators value changes by year
Maximum:
6.772 trl
jan 1, 2015
At the date of observation
Value
Absolute change
Change from previous value
jan 1, 1962
0.0
0.0
-2.56%
jan 1, 1963
0.0
0.0
-18.42%
jan 1, 1964
0.0
+0.0
800.0%
jan 1, 1965
0.0
+0.0
3.58%
jan 1, 1966
0.0
+0.0
27.85%
jan 1, 1967
0.0
0.0
-44.65%
jan 1, 1968
0.0
+0.0
126.65%
jan 1, 1969
0.001
+0.0
56.1%
jan 1, 1970
0.001
+0.0
46.79%
jan 1, 1971
0.001
+0.0
12.76%
jan 1, 1972
0.001
+0.0
24.97%
jan 1, 1973
0.002
+0.0
24.06%
jan 1, 1974
0.002
+0.0
0.19%
jan 1, 1975
0.002
+0.001
48.12%
jan 1, 1976
0.002
0.0
-0.64%
jan 1, 1977
0.003
+0.0
19.78%
jan 1, 1978
0.006
+0.003
109.15%
jan 1, 1979
0.004
-0.002
-30.72%
jan 1, 1980
0.007
+0.003
60.59%
jan 1, 1981
0.012
+0.005
72.69%
jan 1, 1982
0.018
+0.006
49.0%
jan 1, 1983
0.024
+0.007
38.01%
jan 1, 1984
0.048
+0.023
95.73%
jan 1, 1985
0.1
+0.053
110.3%
jan 1, 1986
0.133
+0.033
33.05%
jan 1, 1987
0.206
+0.073
54.61%
jan 1, 1988
0.398
+0.192
93.23%
jan 1, 1989
0.81
+0.412
103.36%
jan 1, 1990
1.526
+0.716
88.37%
jan 1, 1991
2.876
+1.35
88.43%
jan 1, 1992
28.776
+25.9
900.57%
jan 1, 1993
1.255K
+1.226K
4.26K%
jan 1, 1994
6.06K
+4.805K
382.91%
jan 1, 1995
5.244 mln
+5.238 mln
86.43K%
jan 1, 1996
38.269 mln
+33.025 mln
629.81%
jan 1, 1997
784.8 mln
+746.531 mln
1.95K%
jan 1, 1998
200.0 mln
-584.8 mln
-74.52%
jan 1, 1999
209.788 mln
+9.788 mln
4.89%
jan 1, 2000
1.59 bln
+1.381 bln
658.14%
jan 1, 2001
189.9 bln
+188.31 bln
11.84K%
jan 1, 2002
148.7 bln
-41.2 bln
-21.7%
jan 1, 2003
224.8 bln
+76.1 bln
51.18%
jan 1, 2004
341.5 bln
+116.7 bln
51.91%
jan 1, 2005
499.5 bln
+158.0 bln
46.27%
jan 1, 2006
662.0 bln
+162.5 bln
32.53%
jan 1, 2007
987.0 bln
+325.0 bln
49.09%
jan 1, 2008
1.177 trl
+190.299 bln
19.28%
jan 1, 2009
1.189 trl
+12.001 bln
1.02%
jan 1, 2010
2.189 trl
+999.299 bln
84.02%
jan 1, 2011
3.517 trl
+1.328 trl
60.69%
jan 1, 2012
3.736 trl
+219.302 bln
6.24%
jan 1, 2013
5.266 trl
+1.53 trl
40.95%
jan 1, 2014
6.182 trl
+915.904 bln
17.39%
jan 1, 2015
6.772 trl
+590.056 bln
9.55%
jan 1, 2016
5.269 trl
-1.503 trl
-22.2%
Ranking of countries by current statistics by years


Comments: