29
/
en
AIzaSyAYiBZKx7MnpbEhh9jyipgxe19OcubqV5w
April 1, 2024
99981
Cameroon
CMR
true
2
1
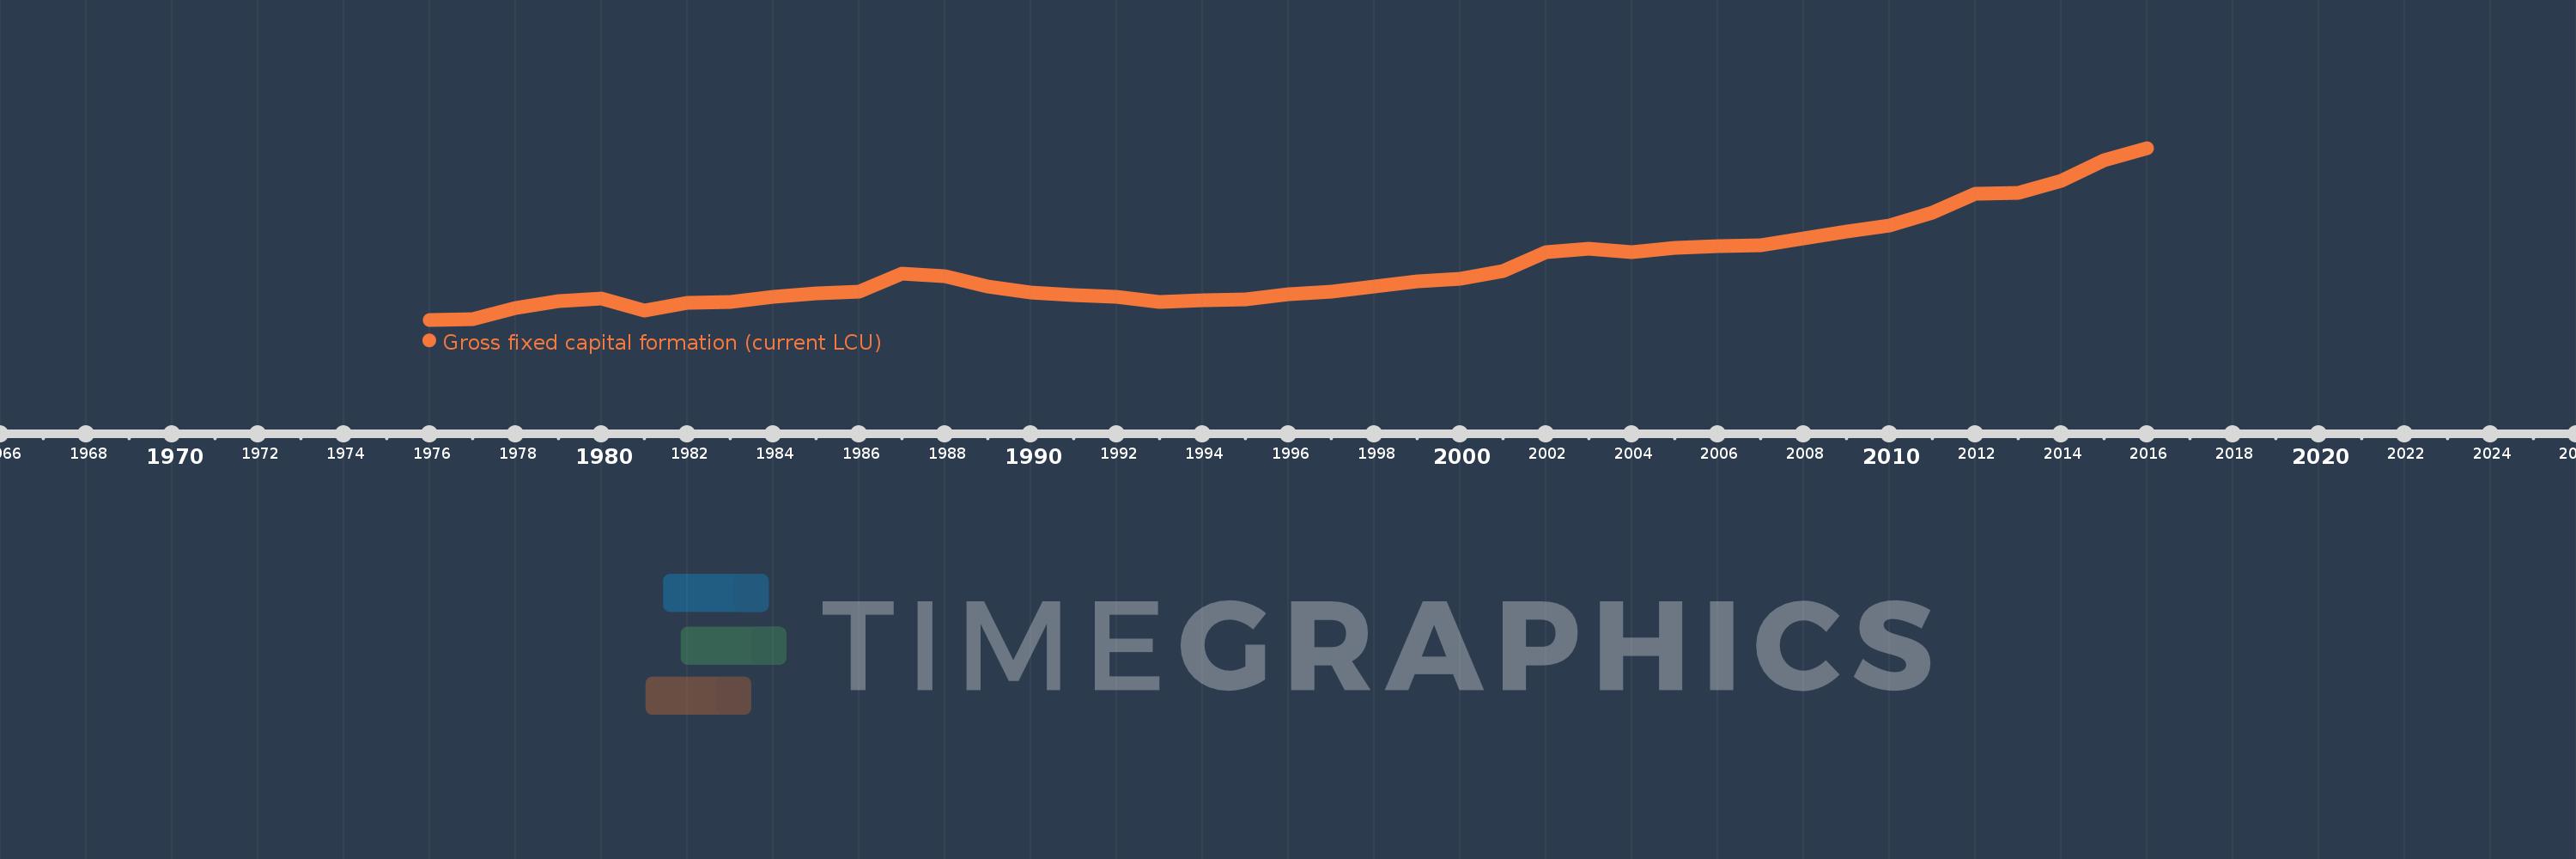
Gross fixed capital formation (current LCU)
2016,2015,2014,2013,2012,2011,2010,2009,2008,2007,2006,2005,2004,2003,2002,2001,2000,1999,1998,1997,1996,1995,1994,1993,1992,1991,1990,1989,1988,1987,1986,1985,1984,1983,1982,1981,1980,1979,1978,1977,1976
This statistics in other country:
AfghanistanAlbaniaAlgeriaAngolaAntigua and BarbudaArgentinaArmeniaArubaAustraliaAustriaAzerbaijanBahamas, TheBahrainBangladeshBarbadosBelarusBelgiumBelizeBeninBermudaBhutanBoliviaBosnia and HerzegovinaBotswanaBrazilBrunei DarussalamBulgariaBurkina FasoBurundiCabo VerdeCambodiaCameroonCanadaCentral African RepublicChadChileChinaColombiaComorosCongo, Dem. Rep.Congo, Rep.Costa RicaCote d'IvoireCroatiaCubaCyprusCzech RepublicDenmarkDjiboutiDominicaDominican RepublicEcuadorEgypt, Arab Rep.El SalvadorEquatorial GuineaEritreaEstoniaEthiopiaFijiFinlandFranceGabonGambia, TheGeorgiaGermanyGhanaGreeceGrenadaGuatemalaGuineaGuinea-BissauGuyanaHaitiHondurasHong Kong SAR, ChinaHungaryIcelandIndiaIndonesiaIran, Islamic Rep.IraqIrelandIsraelItalyJamaicaJapanJordanKazakhstanKenyaKiribatiKorea, Rep.KosovoKuwaitKyrgyz RepublicLao PDRLatviaLebanonLesothoLiberiaLibyaLithuaniaLuxembourgMacao SAR, ChinaMacedonia, FYRMadagascarMalawiMalaysiaMaldivesMaliMaltaMauritaniaMauritiusMexicoMicronesia, Fed. Sts.MoldovaMongoliaMontenegroMoroccoMozambiqueNamibiaNepalNetherlandsNew CaledoniaNew ZealandNicaraguaNigerNigeriaNorwayOmanPakistanPanamaPapua New GuineaParaguayPeruPhilippinesPolandPortugalPuerto RicoRomaniaRussian FederationRwandaSaudi ArabiaSenegalSerbiaSeychellesSierra LeoneSingaporeSlovak RepublicSloveniaSolomon IslandsSomaliaSouth AfricaSouth SudanSpainSri LankaSt. Kitts and NevisSt. LuciaSt. Vincent and the GrenadinesSudanSurinameSwazilandSwedenSwitzerlandSyrian Arab RepublicTajikistanTanzaniaThailandTimor-LesteTogoTongaTrinidad and TobagoTunisiaTurkeyTurkmenistanUgandaUkraineUnited Arab EmiratesUnited KingdomUnited StatesUruguayUzbekistanVanuatuVenezuela, RBVietnamWest Bank and GazaYemen, Rep.ZambiaZimbabwe Timeline:
This timeline shows a graph from 1976 to 2016 of Cameroon. No data until 1975. Number of actual observations by date: 41.
Source name:
World Development Indicators
Source organization:
World Bank national accounts data, and OECD National Accounts data files.
Categories, topics:
Economy & Growth
Last updated:
apr 23, 2017
Indicators value changes by year
Minimum:
100.3 bln
jan 1, 1976
Maximum:
3.491 trl
jan 1, 2016
At the date of observation
Value
Absolute change
Change from previous value
jan 1, 1976
100.3 bln
+100.3 bln
0.0%
jan 1, 1977
118.8 bln
+18.5 bln
18.44%
jan 1, 1978
330.9 bln
+212.1 bln
178.54%
jan 1, 1979
474.7 bln
+143.8 bln
43.46%
jan 1, 1980
511.2 bln
+36.5 bln
7.69%
jan 1, 1981
282.4 bln
-228.8 bln
-44.76%
jan 1, 1982
441.4 bln
+159.0 bln
56.3%
jan 1, 1983
447.4 bln
+6.0 bln
1.36%
jan 1, 1984
552.7 bln
+105.3 bln
23.54%
jan 1, 1985
619.2 bln
+66.5 bln
12.03%
jan 1, 1986
659.9 bln
+40.7 bln
6.57%
jan 1, 1987
1.018 trl
+358.254 bln
54.29%
jan 1, 1988
962.3 bln
-55.854 bln
-5.49%
jan 1, 1989
757.5 bln
-204.8 bln
-21.28%
jan 1, 1990
638.209 bln
-119.291 bln
-15.75%
jan 1, 1991
581.2 bln
-57.009 bln
-8.93%
jan 1, 1992
556.0 bln
-25.2 bln
-4.34%
jan 1, 1993
457.1 bln
-98.9 bln
-17.79%
jan 1, 1994
488.784 bln
+31.684 bln
6.93%
jan 1, 1995
497.923 bln
+9.139 bln
1.87%
jan 1, 1996
608.158 bln
+110.236 bln
22.14%
jan 1, 1997
663.036 bln
+54.877 bln
9.02%
jan 1, 1998
763.419 bln
+100.384 bln
15.14%
jan 1, 1999
863.877 bln
+100.458 bln
13.16%
jan 1, 2000
904.881 bln
+41.003 bln
4.75%
jan 1, 2001
1.058 trl
+153.247 bln
16.94%
jan 1, 2002
1.431 trl
+372.458 bln
35.2%
jan 1, 2003
1.503 trl
+72.52 bln
5.07%
jan 1, 2004
1.431 trl
-72.262 bln
-4.81%
jan 1, 2005
1.521 trl
+90.305 bln
6.31%
jan 1, 2006
1.547 trl
+25.738 bln
1.69%
jan 1, 2007
1.565 trl
+17.643 bln
1.14%
jan 1, 2008
1.702 trl
+137.642 bln
8.8%
jan 1, 2009
1.842 trl
+140.15 bln
8.23%
jan 1, 2010
1.965 trl
+122.579 bln
6.65%
jan 1, 2011
2.22 trl
+254.958 bln
12.98%
jan 1, 2012
2.583 trl
+362.791 bln
16.34%
jan 1, 2013
2.6 trl
+17.407 bln
0.67%
jan 1, 2014
2.834 trl
+234.015 bln
9.0%
jan 1, 2015
3.251 trl
+416.815 bln
14.71%
jan 1, 2016
3.491 trl
+240.414 bln
7.4%
Ranking of countries by current statistics by years


Comments: