29
/
en
AIzaSyAYiBZKx7MnpbEhh9jyipgxe19OcubqV5w
April 1, 2024
224911
Poland
POL
true
2
1
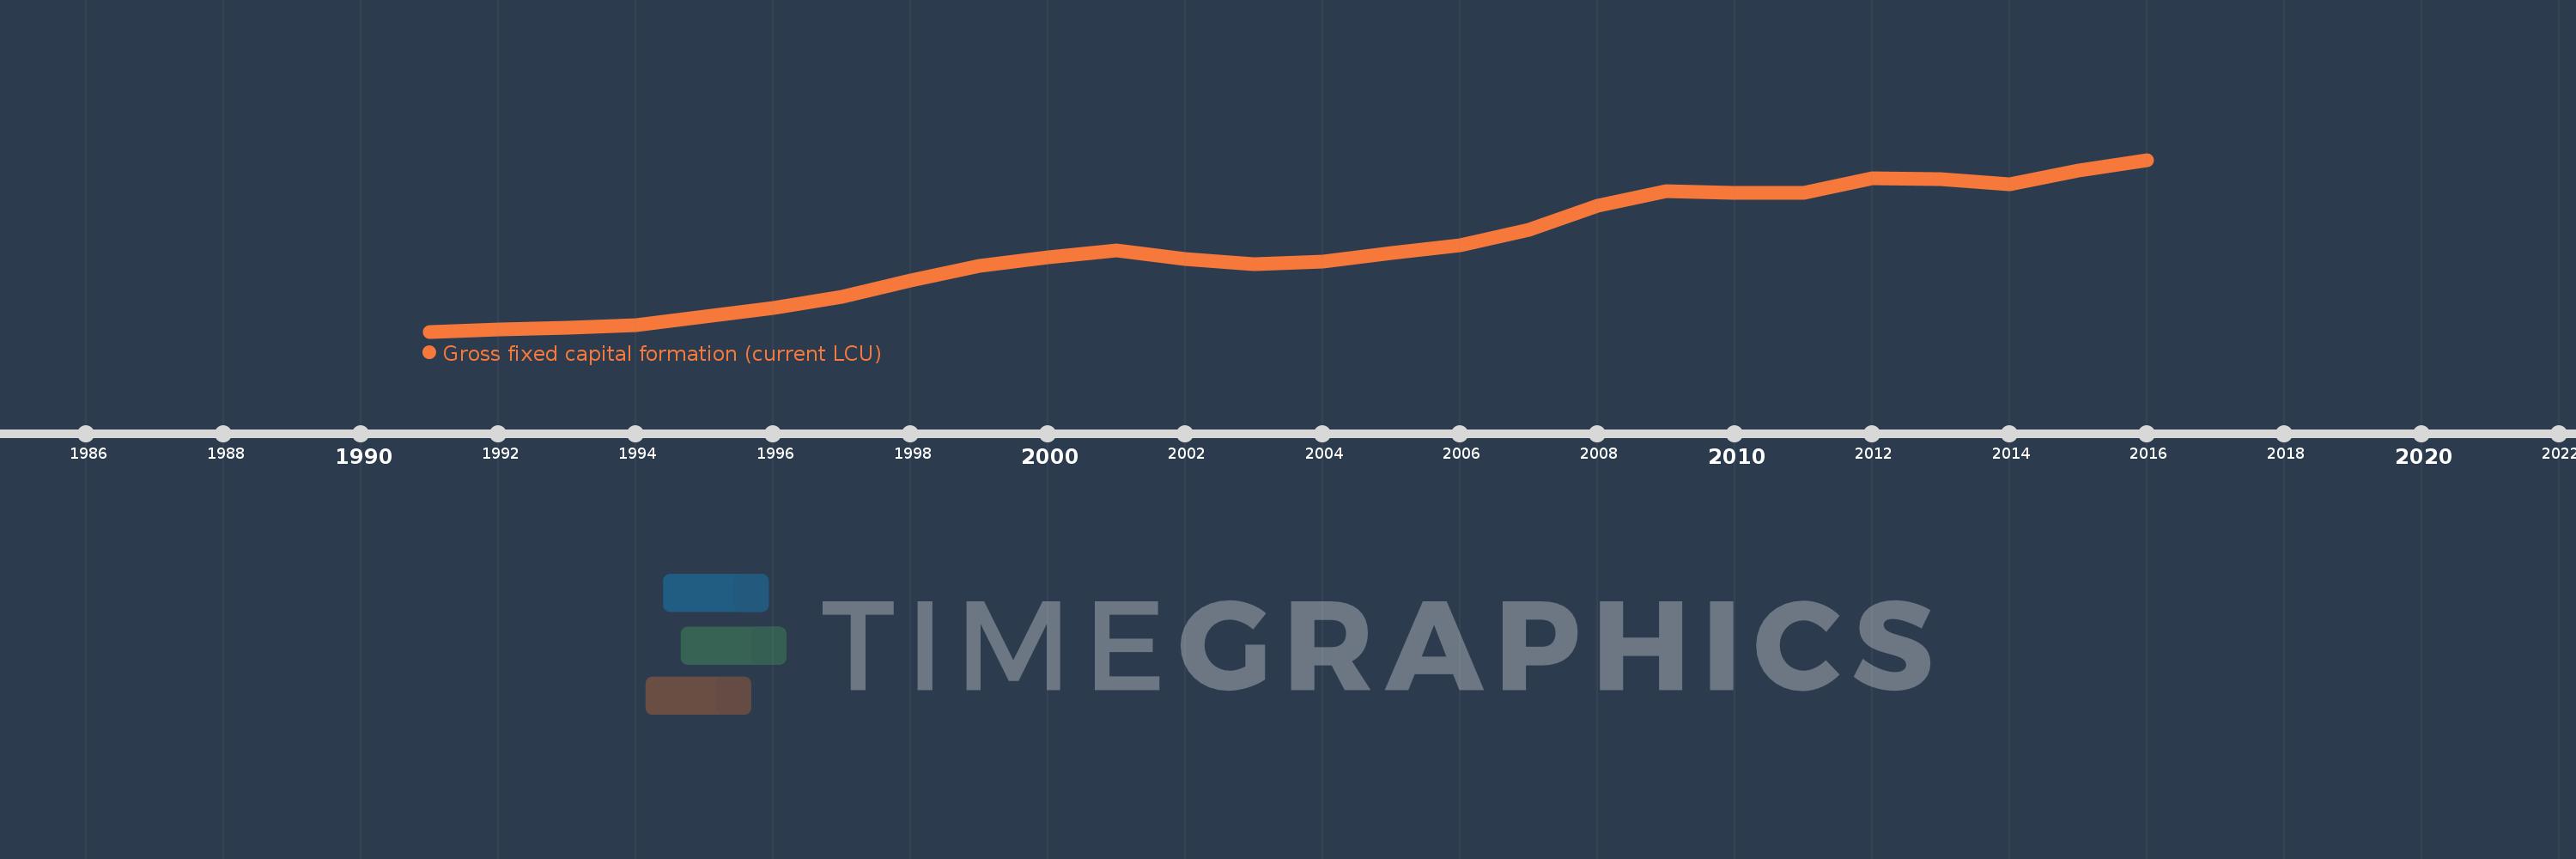
Gross fixed capital formation (current LCU)
2016,2015,2014,2013,2012,2011,2010,2009,2008,2007,2006,2005,2004,2003,2002,2001,2000,1999,1998,1997,1996,1995,1994,1993,1992,1991
This statistics in other country:
AfghanistanAlbaniaAlgeriaAngolaAntigua and BarbudaArgentinaArmeniaArubaAustraliaAustriaAzerbaijanBahamas, TheBahrainBangladeshBarbadosBelarusBelgiumBelizeBeninBermudaBhutanBoliviaBosnia and HerzegovinaBotswanaBrazilBrunei DarussalamBulgariaBurkina FasoBurundiCabo VerdeCambodiaCameroonCanadaCentral African RepublicChadChileChinaColombiaComorosCongo, Dem. Rep.Congo, Rep.Costa RicaCote d'IvoireCroatiaCubaCyprusCzech RepublicDenmarkDjiboutiDominicaDominican RepublicEcuadorEgypt, Arab Rep.El SalvadorEquatorial GuineaEritreaEstoniaEthiopiaFijiFinlandFranceGabonGambia, TheGeorgiaGermanyGhanaGreeceGrenadaGuatemalaGuineaGuinea-BissauGuyanaHaitiHondurasHong Kong SAR, ChinaHungaryIcelandIndiaIndonesiaIran, Islamic Rep.IraqIrelandIsraelItalyJamaicaJapanJordanKazakhstanKenyaKiribatiKorea, Rep.KosovoKuwaitKyrgyz RepublicLao PDRLatviaLebanonLesothoLiberiaLibyaLithuaniaLuxembourgMacao SAR, ChinaMacedonia, FYRMadagascarMalawiMalaysiaMaldivesMaliMaltaMauritaniaMauritiusMexicoMicronesia, Fed. Sts.MoldovaMongoliaMontenegroMoroccoMozambiqueNamibiaNepalNetherlandsNew CaledoniaNew ZealandNicaraguaNigerNigeriaNorwayOmanPakistanPanamaPapua New GuineaParaguayPeruPhilippinesPolandPortugalPuerto RicoRomaniaRussian FederationRwandaSaudi ArabiaSenegalSerbiaSeychellesSierra LeoneSingaporeSlovak RepublicSloveniaSolomon IslandsSomaliaSouth AfricaSouth SudanSpainSri LankaSt. Kitts and NevisSt. LuciaSt. Vincent and the GrenadinesSudanSurinameSwazilandSwedenSwitzerlandSyrian Arab RepublicTajikistanTanzaniaThailandTimor-LesteTogoTongaTrinidad and TobagoTunisiaTurkeyTurkmenistanUgandaUkraineUnited Arab EmiratesUnited KingdomUnited StatesUruguayUzbekistanVanuatuVenezuela, RBVietnamWest Bank and GazaYemen, Rep.ZambiaZimbabwe Timeline:
This timeline shows a graph from 1991 to 2016 of Poland. No data until 1990. Number of actual observations by date: 26.
Source name:
World Development Indicators
Source organization:
World Bank national accounts data, and OECD National Accounts data files.
Categories, topics:
Economy & Growth
Last updated:
apr 23, 2017
Indicators value changes by year
Minimum:
12.313 bln
jan 1, 1991
Maximum:
360.848 bln
jan 1, 2016
At the date of observation
Value
Absolute change
Change from previous value
jan 1, 1991
12.313 bln
+12.313 bln
0.0%
jan 1, 1992
16.515 bln
+4.202 bln
34.13%
jan 1, 1993
20.202 bln
+3.687 bln
22.33%
jan 1, 1994
25.909 bln
+5.708 bln
28.25%
jan 1, 1995
42.279 bln
+16.37 bln
63.18%
jan 1, 1996
60.097 bln
+17.818 bln
42.14%
jan 1, 1997
83.712 bln
+23.615 bln
39.29%
jan 1, 1998
115.633 bln
+31.921 bln
38.13%
jan 1, 1999
145.219 bln
+29.586 bln
25.59%
jan 1, 2000
163.481 bln
+18.262 bln
12.58%
jan 1, 2001
177.338 bln
+13.857 bln
8.48%
jan 1, 2002
159.756 bln
-17.582 bln
-9.91%
jan 1, 2003
149.512 bln
-10.244 bln
-6.41%
jan 1, 2004
153.692 bln
+4.18 bln
2.8%
jan 1, 2005
171.054 bln
+17.362 bln
11.3%
jan 1, 2006
187.141 bln
+16.087 bln
9.4%
jan 1, 2007
218.217 bln
+31.076 bln
16.61%
jan 1, 2008
266.776 bln
+48.559 bln
22.25%
jan 1, 2009
297.042 bln
+30.266 bln
11.35%
jan 1, 2010
294.21 bln
-2.832 bln
-0.95%
jan 1, 2011
293.168 bln
-1.042 bln
-0.35%
jan 1, 2012
324.075 bln
+30.907 bln
10.54%
jan 1, 2013
322.452 bln
-1.623 bln
-0.5%
jan 1, 2014
311.695 bln
-10.757 bln
-3.34%
jan 1, 2015
339.389 bln
+27.694 bln
8.88%
jan 1, 2016
360.848 bln
+21.459 bln
6.32%
Ranking of countries by current statistics by years


Comments: