29
/
en
AIzaSyAYiBZKx7MnpbEhh9jyipgxe19OcubqV5w
April 1, 2024
240824
Singapore
SGP
true
2
1
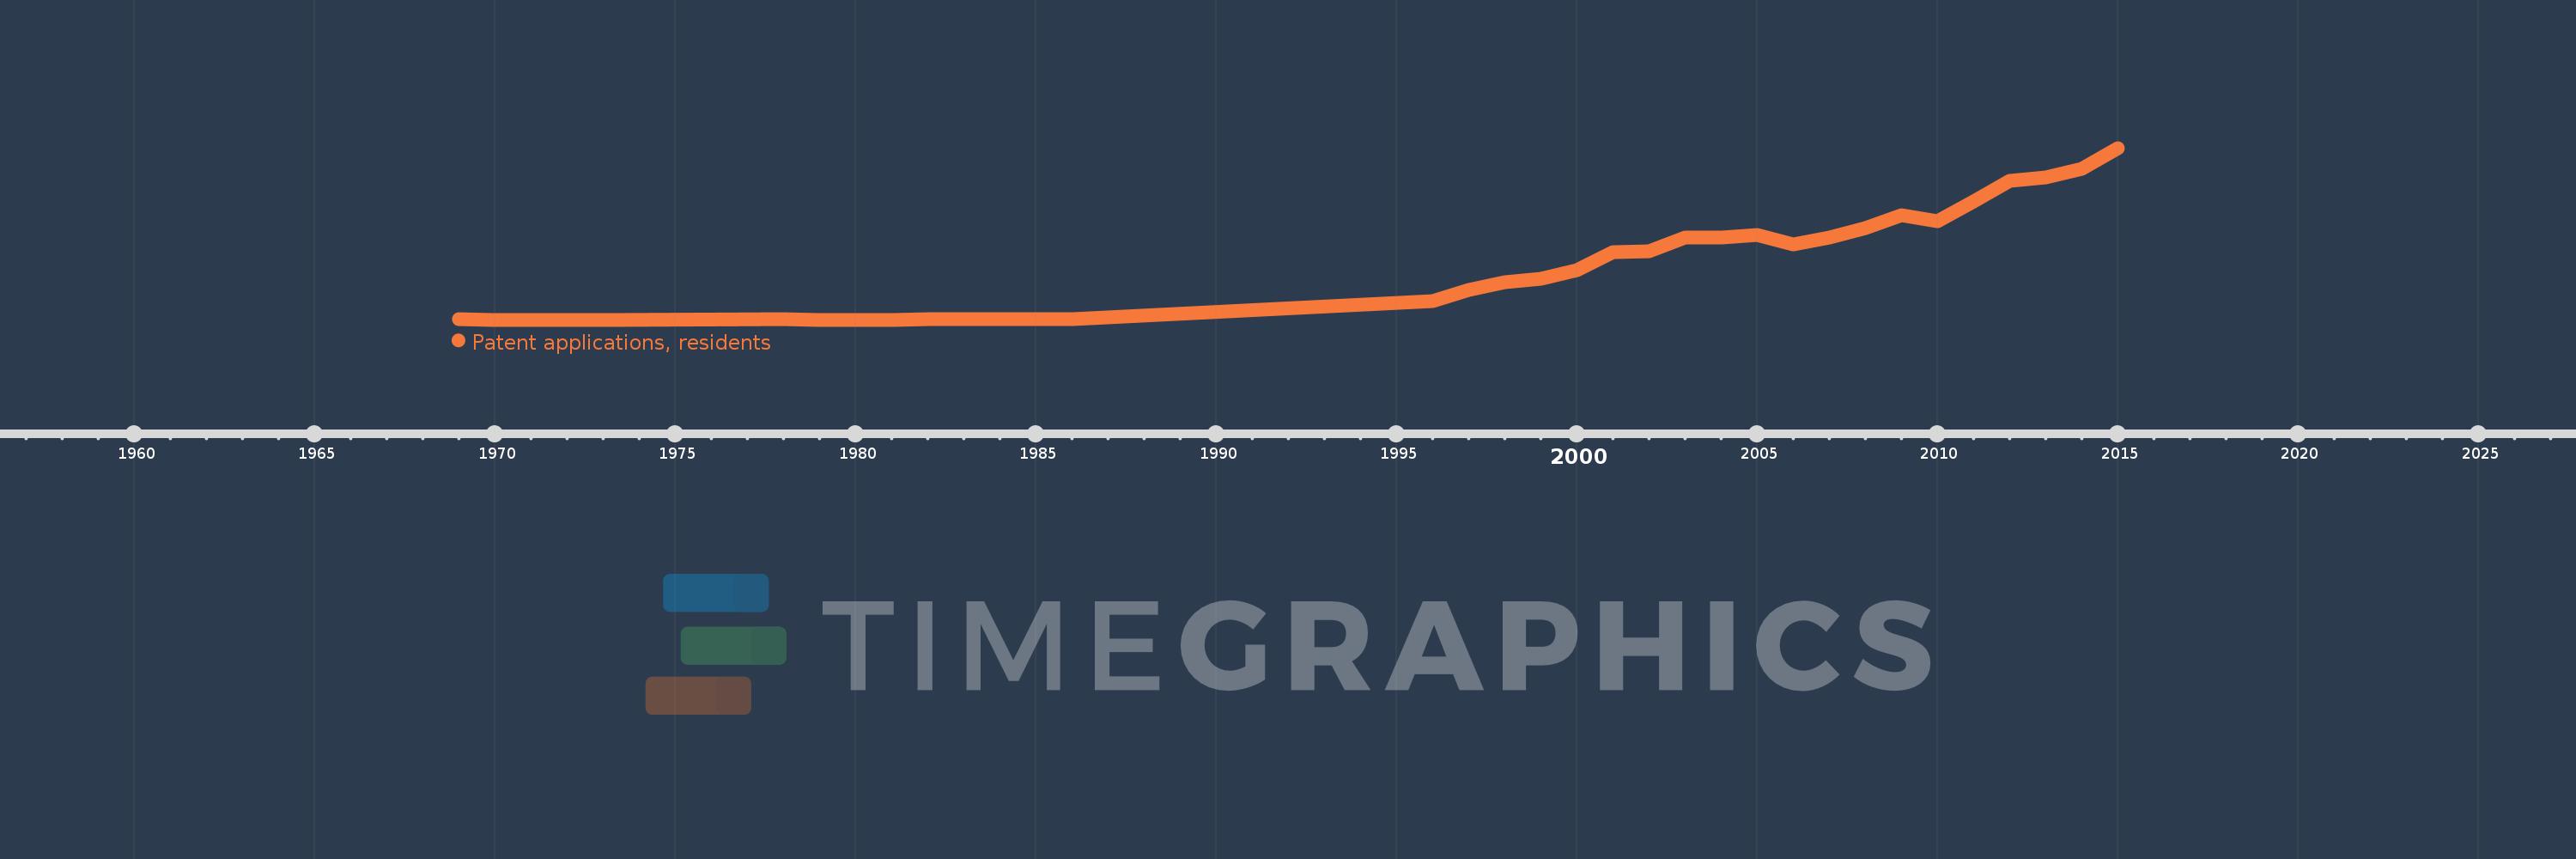
Patent applications, residents
2015,2014,2013,2012,2011,2010,2009,2008,2007,2006,2005,2004,2003,2002,2001,2000,1999,1998,1997,1996,1986,1985,1984,1982,1981,1979,1978,1973,1972,1971,1970,1969
This statistics in other country:
AlbaniaAlgeriaAngolaArab WorldArgentinaArmeniaArubaAustraliaAustriaAzerbaijanBahamas, TheBahrainBangladeshBarbadosBelarusBelgiumBelizeBhutanBoliviaBosnia and HerzegovinaBotswanaBrazilBrunei DarussalamBulgariaBurkina FasoBurundiCambodiaCanadaCaribbean small statesCentral Europe and the BalticsChileChinaColombiaCongo, Dem. Rep.Congo, Rep.Costa RicaCote d'IvoireCroatiaCubaCyprusCzech RepublicDenmarkDjiboutiDominican RepublicEarly-demographic dividendEast Asia & PacificEast Asia & Pacific (excluding high income)East Asia & Pacific (IDA & IBRD countries)EcuadorEgypt, Arab Rep.El SalvadorEstoniaEthiopiaEuro areaEurope & Central AsiaEurope & Central Asia (excluding high income)Europe & Central Asia (IDA & IBRD countries)European UnionFijiFinlandFranceGeorgiaGermanyGreeceGuatemalaGuyanaHaitiHigh incomeHondurasHong Kong SAR, ChinaHungaryIBRD onlyIcelandIDA & IBRD totalIDA blendIndiaIndonesiaIran, Islamic Rep.IraqIrelandIsraelItalyJamaicaJapanJordanKazakhstanKenyaKiribatiKorea, Dem. People’s Rep.Korea, Rep.KuwaitKyrgyz RepublicLao PDRLate-demographic dividendLatin America & Caribbean Latin America & Caribbean (excluding high income)Latin America & the Caribbean (IDA & IBRD countries)LatviaLebanonLesothoLiberiaLibyaLithuaniaLow & middle incomeLower middle incomeLuxembourgMacao SAR, ChinaMacedonia, FYRMadagascarMalawiMalaysiaMaliMaltaMauritiusMexicoMiddle East & North AfricaMiddle East & North Africa (excluding high income)Middle East & North Africa (IDA & IBRD countries)Middle incomeMoldovaMonacoMongoliaMontenegroMoroccoMozambiqueNamibiaNepalNetherlandsNew ZealandNicaraguaNigeriaNorth AmericaNorwayOECD membersPakistanPanamaPapua New GuineaParaguayPeruPhilippinesPolandPortugalPost-demographic dividendQatarRomaniaRussian FederationRwandaSamoaSaudi ArabiaSerbiaSierra LeoneSingaporeSlovak RepublicSloveniaSomaliaSouth AfricaSouth AsiaSouth Asia (IDA & IBRD)SpainSri LankaSudanSwazilandSwedenSwitzerlandSyrian Arab RepublicTajikistanTanzaniaThailandTrinidad and TobagoTunisiaTurkeyTurkmenistanUgandaUkraineUnited Arab EmiratesUnited KingdomUnited StatesUpper middle incomeUruguayUzbekistanVenezuela, RBVietnamWorldYemen, Rep.ZambiaZimbabwe Timeline:
This timeline shows a graph from 1969 to 2015 of Singapore. No data until 1968. Number of actual observations by date: 32.
Source name:
World Development Indicators
Source organization:
World Intellectual Property Organization (WIPO), WIPO Patent Report: Statistics on Worldwide Patent Activity. The International Bureau of WIPO assumes no responsibility with respect to the transformation of these data.
Categories, topics:
Science & Technology
Last updated:
apr 23, 2017
Indicators value changes by year
Maximum:
1.303K
jan 1, 2015
At the date of observation
Value
Absolute change
Change from previous value
jan 1, 1970
1.0
-4.0
-80.0%
jan 1, 1972
2.0
+1.0
100.0%
jan 1, 1978
4.0
+2.0
100.0%
jan 1, 1979
2.0
-2.0
-50.0%
jan 1, 1982
4.0
+2.0
100.0%
jan 1, 1984
5.0
+1.0
25.0%
jan 1, 1985
4.0
-1.0
-20.0%
jan 1, 1996
145.0
+141.0
3.52K%
jan 1, 1997
224.0
+79.0
54.48%
jan 1, 1998
288.0
+64.0
28.57%
jan 1, 1999
311.0
+23.0
7.99%
jan 1, 2000
374.0
+63.0
20.26%
jan 1, 2001
516.0
+142.0
37.97%
jan 1, 2002
523.0
+7.0
1.36%
jan 1, 2003
624.0
+101.0
19.31%
jan 1, 2004
626.0
+2.0
0.32%
jan 1, 2005
641.0
+15.0
2.4%
jan 1, 2006
569.0
-72.0
-11.23%
jan 1, 2007
626.0
+57.0
10.02%
jan 1, 2008
696.0
+70.0
11.18%
jan 1, 2009
793.0
+97.0
13.94%
jan 1, 2010
750.0
-43.0
-5.42%
jan 1, 2011
895.0
+145.0
19.33%
jan 1, 2012
1.056K
+161.0
17.99%
jan 1, 2013
1.081K
+25.0
2.37%
jan 1, 2014
1.143K
+62.0
5.74%
jan 1, 2015
1.303K
+160.0
14.0%
Ranking of countries by current statistics by years


Comments: