29
/
en
AIzaSyAYiBZKx7MnpbEhh9jyipgxe19OcubqV5w
April 1, 2024
269807
Turkey
TUR
true
2
1
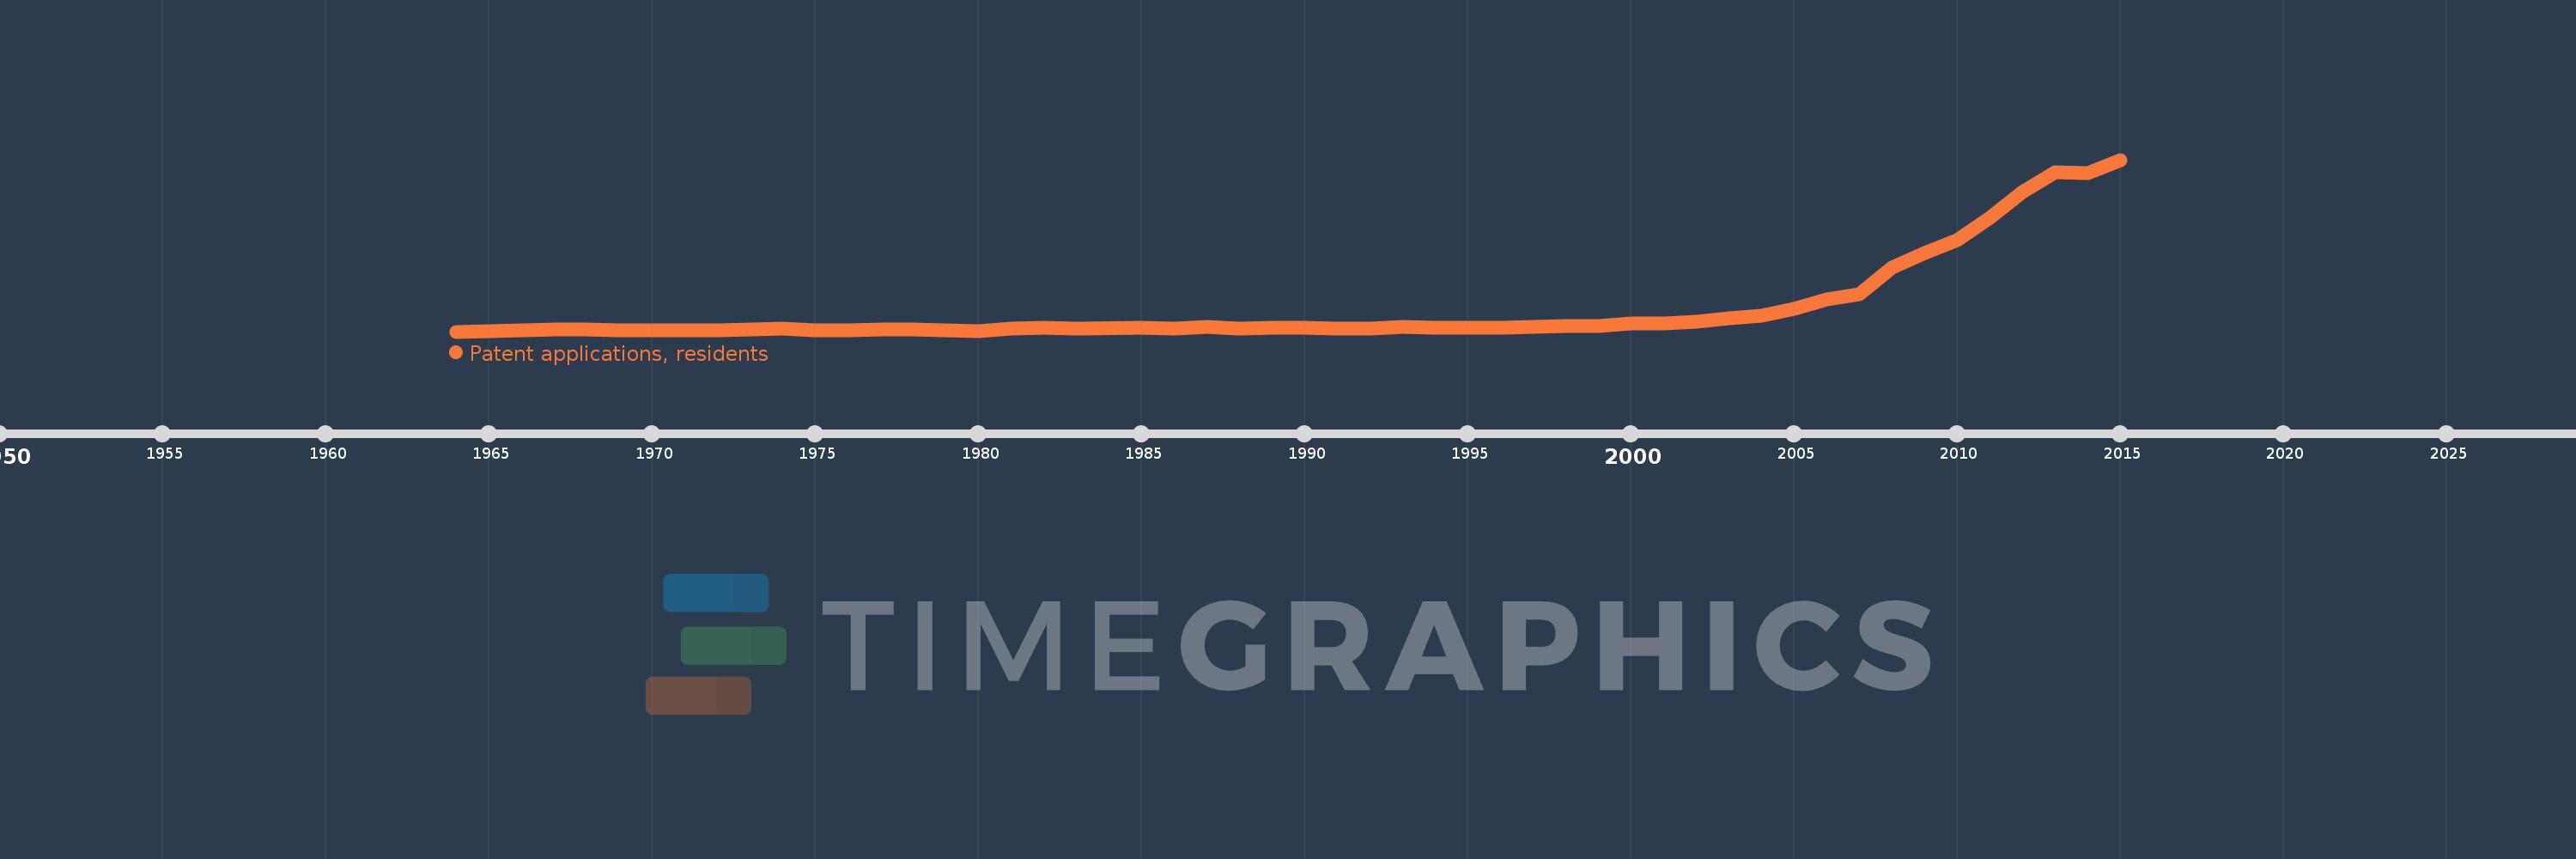
Patent applications, residents
2015,2014,2013,2012,2011,2010,2009,2008,2007,2006,2005,2004,2003,2002,2001,2000,1999,1998,1997,1996,1995,1994,1993,1992,1991,1990,1989,1988,1987,1986,1985,1983,1982,1981,1980,1979,1978,1977,1976,1975,1974,1972,1971,1970,1969,1968,1967,1966,1965,1964
This statistics in other country:
AlbaniaAlgeriaAngolaArab WorldArgentinaArmeniaArubaAustraliaAustriaAzerbaijanBahamas, TheBahrainBangladeshBarbadosBelarusBelgiumBelizeBhutanBoliviaBosnia and HerzegovinaBotswanaBrazilBrunei DarussalamBulgariaBurkina FasoBurundiCambodiaCanadaCaribbean small statesCentral Europe and the BalticsChileChinaColombiaCongo, Dem. Rep.Congo, Rep.Costa RicaCote d'IvoireCroatiaCubaCyprusCzech RepublicDenmarkDjiboutiDominican RepublicEarly-demographic dividendEast Asia & PacificEast Asia & Pacific (excluding high income)East Asia & Pacific (IDA & IBRD countries)EcuadorEgypt, Arab Rep.El SalvadorEstoniaEthiopiaEuro areaEurope & Central AsiaEurope & Central Asia (excluding high income)Europe & Central Asia (IDA & IBRD countries)European UnionFijiFinlandFranceGeorgiaGermanyGreeceGuatemalaGuyanaHaitiHigh incomeHondurasHong Kong SAR, ChinaHungaryIBRD onlyIcelandIDA & IBRD totalIDA blendIndiaIndonesiaIran, Islamic Rep.IraqIrelandIsraelItalyJamaicaJapanJordanKazakhstanKenyaKiribatiKorea, Dem. People’s Rep.Korea, Rep.KuwaitKyrgyz RepublicLao PDRLate-demographic dividendLatin America & Caribbean Latin America & Caribbean (excluding high income)Latin America & the Caribbean (IDA & IBRD countries)LatviaLebanonLesothoLiberiaLibyaLithuaniaLow & middle incomeLower middle incomeLuxembourgMacao SAR, ChinaMacedonia, FYRMadagascarMalawiMalaysiaMaliMaltaMauritiusMexicoMiddle East & North AfricaMiddle East & North Africa (excluding high income)Middle East & North Africa (IDA & IBRD countries)Middle incomeMoldovaMonacoMongoliaMontenegroMoroccoMozambiqueNamibiaNepalNetherlandsNew ZealandNicaraguaNigeriaNorth AmericaNorwayOECD membersPakistanPanamaPapua New GuineaParaguayPeruPhilippinesPolandPortugalPost-demographic dividendQatarRomaniaRussian FederationRwandaSamoaSaudi ArabiaSerbiaSierra LeoneSingaporeSlovak RepublicSloveniaSomaliaSouth AfricaSouth AsiaSouth Asia (IDA & IBRD)SpainSri LankaSudanSwazilandSwedenSwitzerlandSyrian Arab RepublicTajikistanTanzaniaThailandTrinidad and TobagoTunisiaTurkeyTurkmenistanUgandaUkraineUnited Arab EmiratesUnited KingdomUnited StatesUpper middle incomeUruguayUzbekistanVenezuela, RBVietnamWorldYemen, Rep.ZambiaZimbabwe Timeline:
This timeline shows a graph from 1964 to 2015 of Turkey. No data until 1963. Number of actual observations by date: 50.
Source name:
World Development Indicators
Source organization:
World Intellectual Property Organization (WIPO), WIPO Patent Report: Statistics on Worldwide Patent Activity. The International Bureau of WIPO assumes no responsibility with respect to the transformation of these data.
Categories, topics:
Science & Technology
Last updated:
apr 23, 2017
Indicators value changes by year
Maximum:
4.766K
jan 1, 2015
At the date of observation
Value
Absolute change
Change from previous value
jan 1, 1964
55.0
+55.0
0.0%
jan 1, 1965
78.0
+23.0
41.82%
jan 1, 1966
99.0
+21.0
26.92%
jan 1, 1967
124.0
+25.0
25.25%
jan 1, 1968
107.0
-17.0
-13.71%
jan 1, 1969
87.0
-20.0
-18.69%
jan 1, 1970
85.0
-2.0
-2.3%
jan 1, 1971
89.0
+4.0
4.71%
jan 1, 1972
96.0
+7.0
7.87%
jan 1, 1974
137.0
+41.0
42.71%
jan 1, 1975
92.0
-45.0
-32.85%
jan 1, 1976
98.0
+6.0
6.52%
jan 1, 1977
118.0
+20.0
20.41%
jan 1, 1978
119.0
+1.0
0.85%
jan 1, 1979
89.0
-30.0
-25.21%
jan 1, 1980
73.0
-16.0
-17.98%
jan 1, 1981
134.0
+61.0
83.56%
jan 1, 1982
157.0
+23.0
17.16%
jan 1, 1983
126.0
-31.0
-19.75%
jan 1, 1985
153.0
+27.0
21.43%
jan 1, 1986
132.0
-21.0
-13.73%
jan 1, 1987
174.0
+42.0
31.82%
jan 1, 1988
138.0
-36.0
-20.69%
jan 1, 1989
153.0
+15.0
10.87%
jan 1, 1990
162.0
+9.0
5.88%
jan 1, 1991
138.0
-24.0
-14.81%
jan 1, 1992
148.0
+10.0
7.25%
jan 1, 1993
189.0
+41.0
27.7%
jan 1, 1994
169.0
-20.0
-10.58%
jan 1, 1995
151.0
-18.0
-10.65%
jan 1, 1996
170.0
+19.0
12.58%
jan 1, 1997
189.0
+19.0
11.18%
jan 1, 1998
203.0
+14.0
7.41%
jan 1, 1999
207.0
+4.0
1.97%
jan 1, 2000
276.0
+69.0
33.33%
jan 1, 2001
277.0
+1.0
0.36%
jan 1, 2002
337.0
+60.0
21.66%
jan 1, 2003
414.0
+77.0
22.85%
jan 1, 2004
489.0
+75.0
18.12%
jan 1, 2005
682.0
+193.0
39.47%
jan 1, 2006
928.0
+246.0
36.07%
jan 1, 2007
1.072K
+144.0
15.52%
jan 1, 2008
1.81K
+738.0
68.84%
jan 1, 2009
2.221K
+411.0
22.71%
jan 1, 2010
2.555K
+334.0
15.04%
jan 1, 2011
3.18K
+625.0
24.46%
jan 1, 2012
3.885K
+705.0
22.17%
jan 1, 2013
4.434K
+549.0
14.13%
jan 1, 2014
4.392K
-42.0
-0.95%
jan 1, 2015
4.766K
+374.0
8.52%
Ranking of countries by current statistics by years


Comments: