29
/
en
AIzaSyAYiBZKx7MnpbEhh9jyipgxe19OcubqV5w
April 1, 2024
125266
Egypt, Arab Rep.
EGY
true
2
1
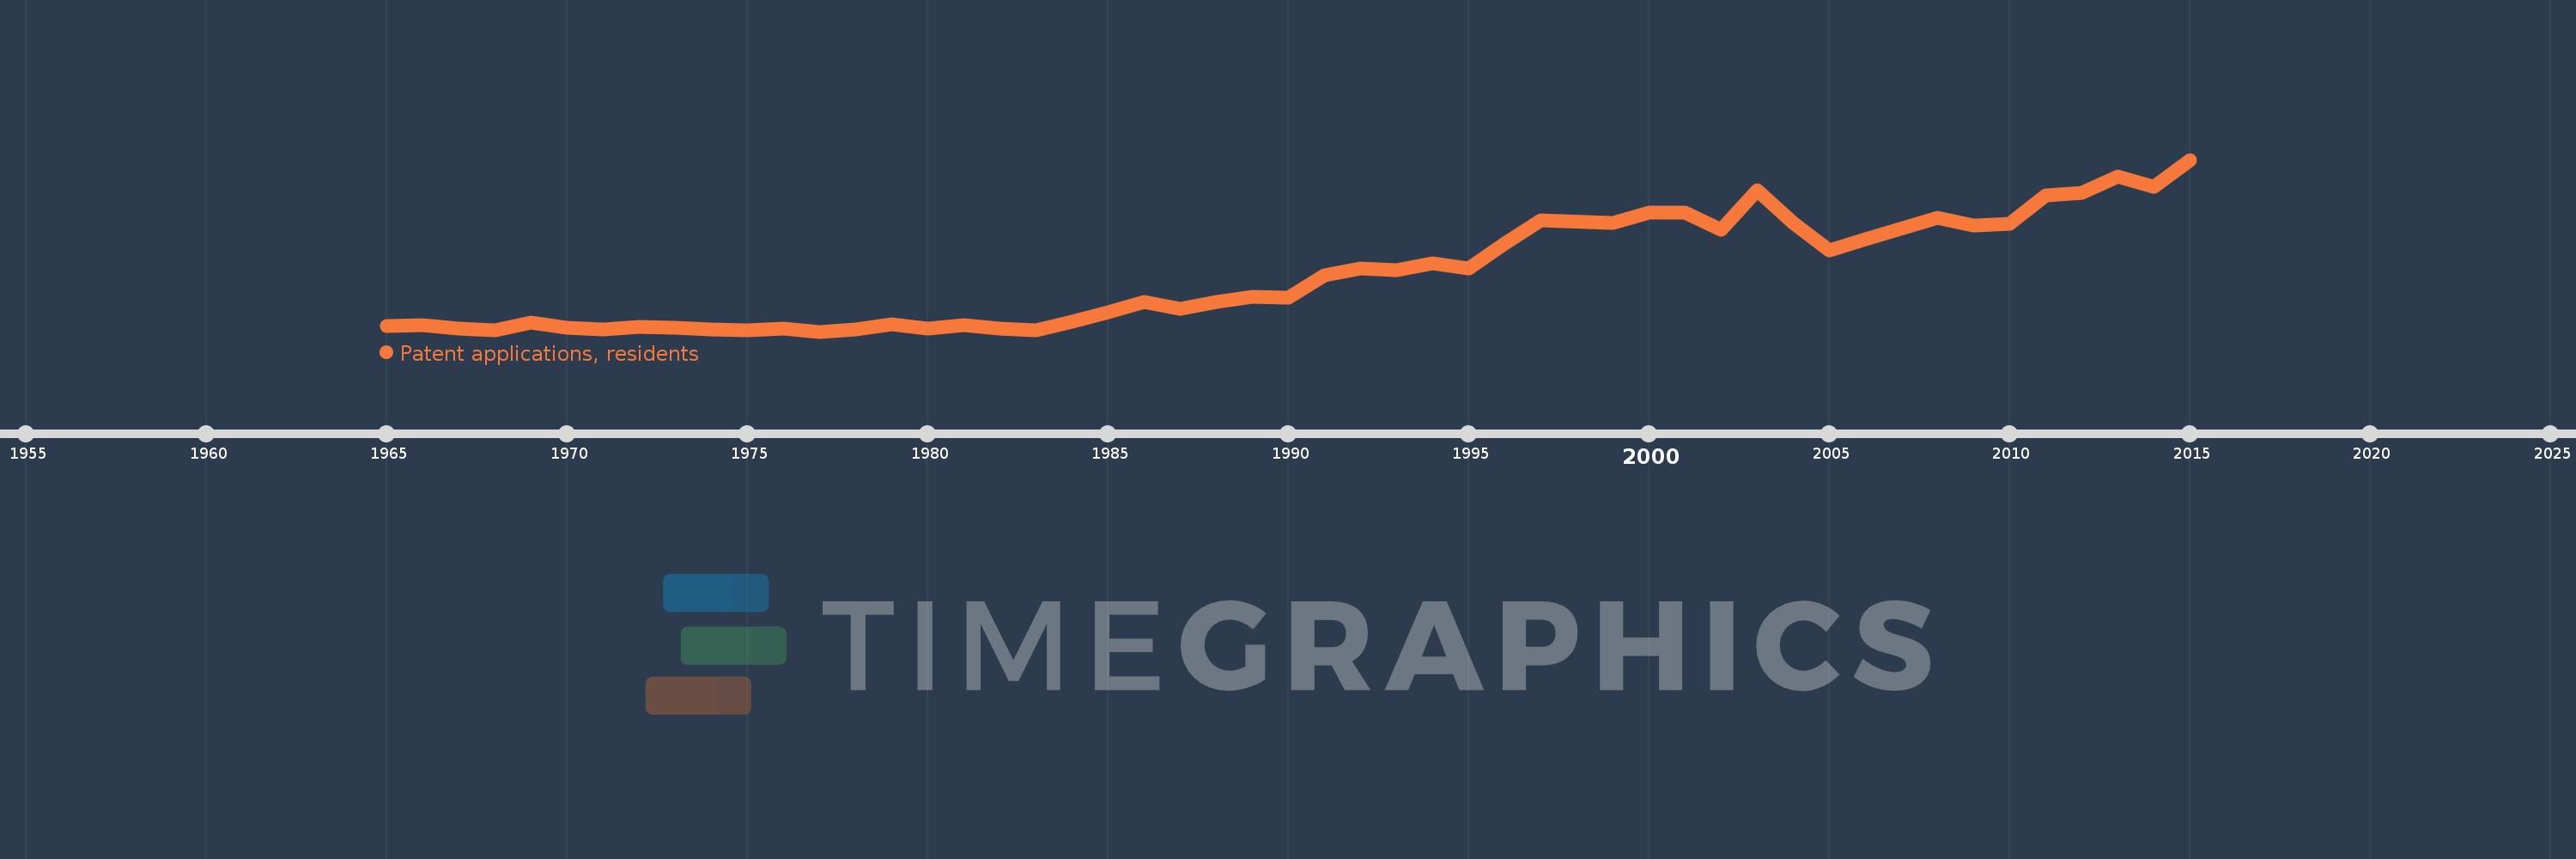
Patent applications, residents
2015,2014,2013,2012,2011,2010,2009,2008,2006,2005,2004,2003,2002,2001,2000,1999,1997,1996,1995,1994,1993,1992,1991,1990,1989,1988,1987,1986,1985,1984,1983,1982,1981,1980,1979,1978,1977,1976,1975,1974,1973,1972,1971,1970,1969,1968,1967,1966,1965
This statistics in other country:
AlbaniaAlgeriaAngolaArab WorldArgentinaArmeniaArubaAustraliaAustriaAzerbaijanBahamas, TheBahrainBangladeshBarbadosBelarusBelgiumBelizeBhutanBoliviaBosnia and HerzegovinaBotswanaBrazilBrunei DarussalamBulgariaBurkina FasoBurundiCambodiaCanadaCaribbean small statesCentral Europe and the BalticsChileChinaColombiaCongo, Dem. Rep.Congo, Rep.Costa RicaCote d'IvoireCroatiaCubaCyprusCzech RepublicDenmarkDjiboutiDominican RepublicEarly-demographic dividendEast Asia & PacificEast Asia & Pacific (excluding high income)East Asia & Pacific (IDA & IBRD countries)EcuadorEgypt, Arab Rep.El SalvadorEstoniaEthiopiaEuro areaEurope & Central AsiaEurope & Central Asia (excluding high income)Europe & Central Asia (IDA & IBRD countries)European UnionFijiFinlandFranceGeorgiaGermanyGreeceGuatemalaGuyanaHaitiHigh incomeHondurasHong Kong SAR, ChinaHungaryIBRD onlyIcelandIDA & IBRD totalIDA blendIndiaIndonesiaIran, Islamic Rep.IraqIrelandIsraelItalyJamaicaJapanJordanKazakhstanKenyaKiribatiKorea, Dem. People’s Rep.Korea, Rep.KuwaitKyrgyz RepublicLao PDRLate-demographic dividendLatin America & Caribbean Latin America & Caribbean (excluding high income)Latin America & the Caribbean (IDA & IBRD countries)LatviaLebanonLesothoLiberiaLibyaLithuaniaLow & middle incomeLower middle incomeLuxembourgMacao SAR, ChinaMacedonia, FYRMadagascarMalawiMalaysiaMaliMaltaMauritiusMexicoMiddle East & North AfricaMiddle East & North Africa (excluding high income)Middle East & North Africa (IDA & IBRD countries)Middle incomeMoldovaMonacoMongoliaMontenegroMoroccoMozambiqueNamibiaNepalNetherlandsNew ZealandNicaraguaNigeriaNorth AmericaNorwayOECD membersPakistanPanamaPapua New GuineaParaguayPeruPhilippinesPolandPortugalPost-demographic dividendQatarRomaniaRussian FederationRwandaSamoaSaudi ArabiaSerbiaSierra LeoneSingaporeSlovak RepublicSloveniaSomaliaSouth AfricaSouth AsiaSouth Asia (IDA & IBRD)SpainSri LankaSudanSwazilandSwedenSwitzerlandSyrian Arab RepublicTajikistanTanzaniaThailandTrinidad and TobagoTunisiaTurkeyTurkmenistanUgandaUkraineUnited Arab EmiratesUnited KingdomUnited StatesUpper middle incomeUruguayUzbekistanVenezuela, RBVietnamWorldYemen, Rep.ZambiaZimbabwe Timeline:
This timeline shows a graph from 1965 to 2015 of Egypt, Arab Rep.. No data until 1964. Number of actual observations by date: 49.
Source name:
World Development Indicators
Source organization:
World Intellectual Property Organization (WIPO), WIPO Patent Report: Statistics on Worldwide Patent Activity. The International Bureau of WIPO assumes no responsibility with respect to the transformation of these data.
Categories, topics:
Science & Technology
Last updated:
apr 23, 2017
Indicators value changes by year
At the date of observation
Value
Absolute change
Change from previous value
jan 1, 1965
70.0
+70.0
0.0%
jan 1, 1966
74.0
+4.0
5.71%
jan 1, 1967
60.0
-14.0
-18.92%
jan 1, 1968
53.0
-7.0
-11.67%
jan 1, 1969
86.0
+33.0
62.26%
jan 1, 1970
65.0
-21.0
-24.42%
jan 1, 1971
57.0
-8.0
-12.31%
jan 1, 1972
66.0
+9.0
15.79%
jan 1, 1973
64.0
-2.0
-3.03%
jan 1, 1974
57.0
-7.0
-10.94%
jan 1, 1975
54.0
-3.0
-5.26%
jan 1, 1976
61.0
+7.0
12.96%
jan 1, 1977
48.0
-13.0
-21.31%
jan 1, 1978
58.0
+10.0
20.83%
jan 1, 1979
77.0
+19.0
32.76%
jan 1, 1980
61.0
-16.0
-20.78%
jan 1, 1981
76.0
+15.0
24.59%
jan 1, 1982
59.0
-17.0
-22.37%
jan 1, 1983
53.0
-6.0
-10.17%
jan 1, 1984
88.0
+35.0
66.04%
jan 1, 1985
128.0
+40.0
45.45%
jan 1, 1986
168.0
+40.0
31.25%
jan 1, 1987
142.0
-26.0
-15.48%
jan 1, 1988
170.0
+28.0
19.72%
jan 1, 1989
190.0
+20.0
11.76%
jan 1, 1990
186.0
-4.0
-2.11%
jan 1, 1991
278.0
+92.0
49.46%
jan 1, 1992
308.0
+30.0
10.79%
jan 1, 1993
301.0
-7.0
-2.27%
jan 1, 1994
328.0
+27.0
8.97%
jan 1, 1995
308.0
-20.0
-6.1%
jan 1, 1996
408.0
+100.0
32.47%
jan 1, 1997
504.0
+96.0
23.53%
jan 1, 1999
494.0
-10.0
-1.98%
jan 1, 2000
536.0
+42.0
8.5%
jan 1, 2001
534.0
-2.0
-0.37%
jan 1, 2002
464.0
-70.0
-13.11%
jan 1, 2003
627.0
+163.0
35.13%
jan 1, 2004
493.0
-134.0
-21.37%
jan 1, 2005
382.0
-111.0
-22.52%
jan 1, 2006
428.0
+46.0
12.04%
jan 1, 2008
516.0
+88.0
20.56%
jan 1, 2009
481.0
-35.0
-6.78%
jan 1, 2010
490.0
+9.0
1.87%
jan 1, 2011
605.0
+115.0
23.47%
jan 1, 2012
618.0
+13.0
2.15%
jan 1, 2013
683.0
+65.0
10.52%
jan 1, 2014
641.0
-42.0
-6.15%
jan 1, 2015
752.0
+111.0
17.32%
Ranking of countries by current statistics by years


Comments: