29
/
en
AIzaSyAYiBZKx7MnpbEhh9jyipgxe19OcubqV5w
April 1, 2024
262726
Thailand
THA
true
2
1
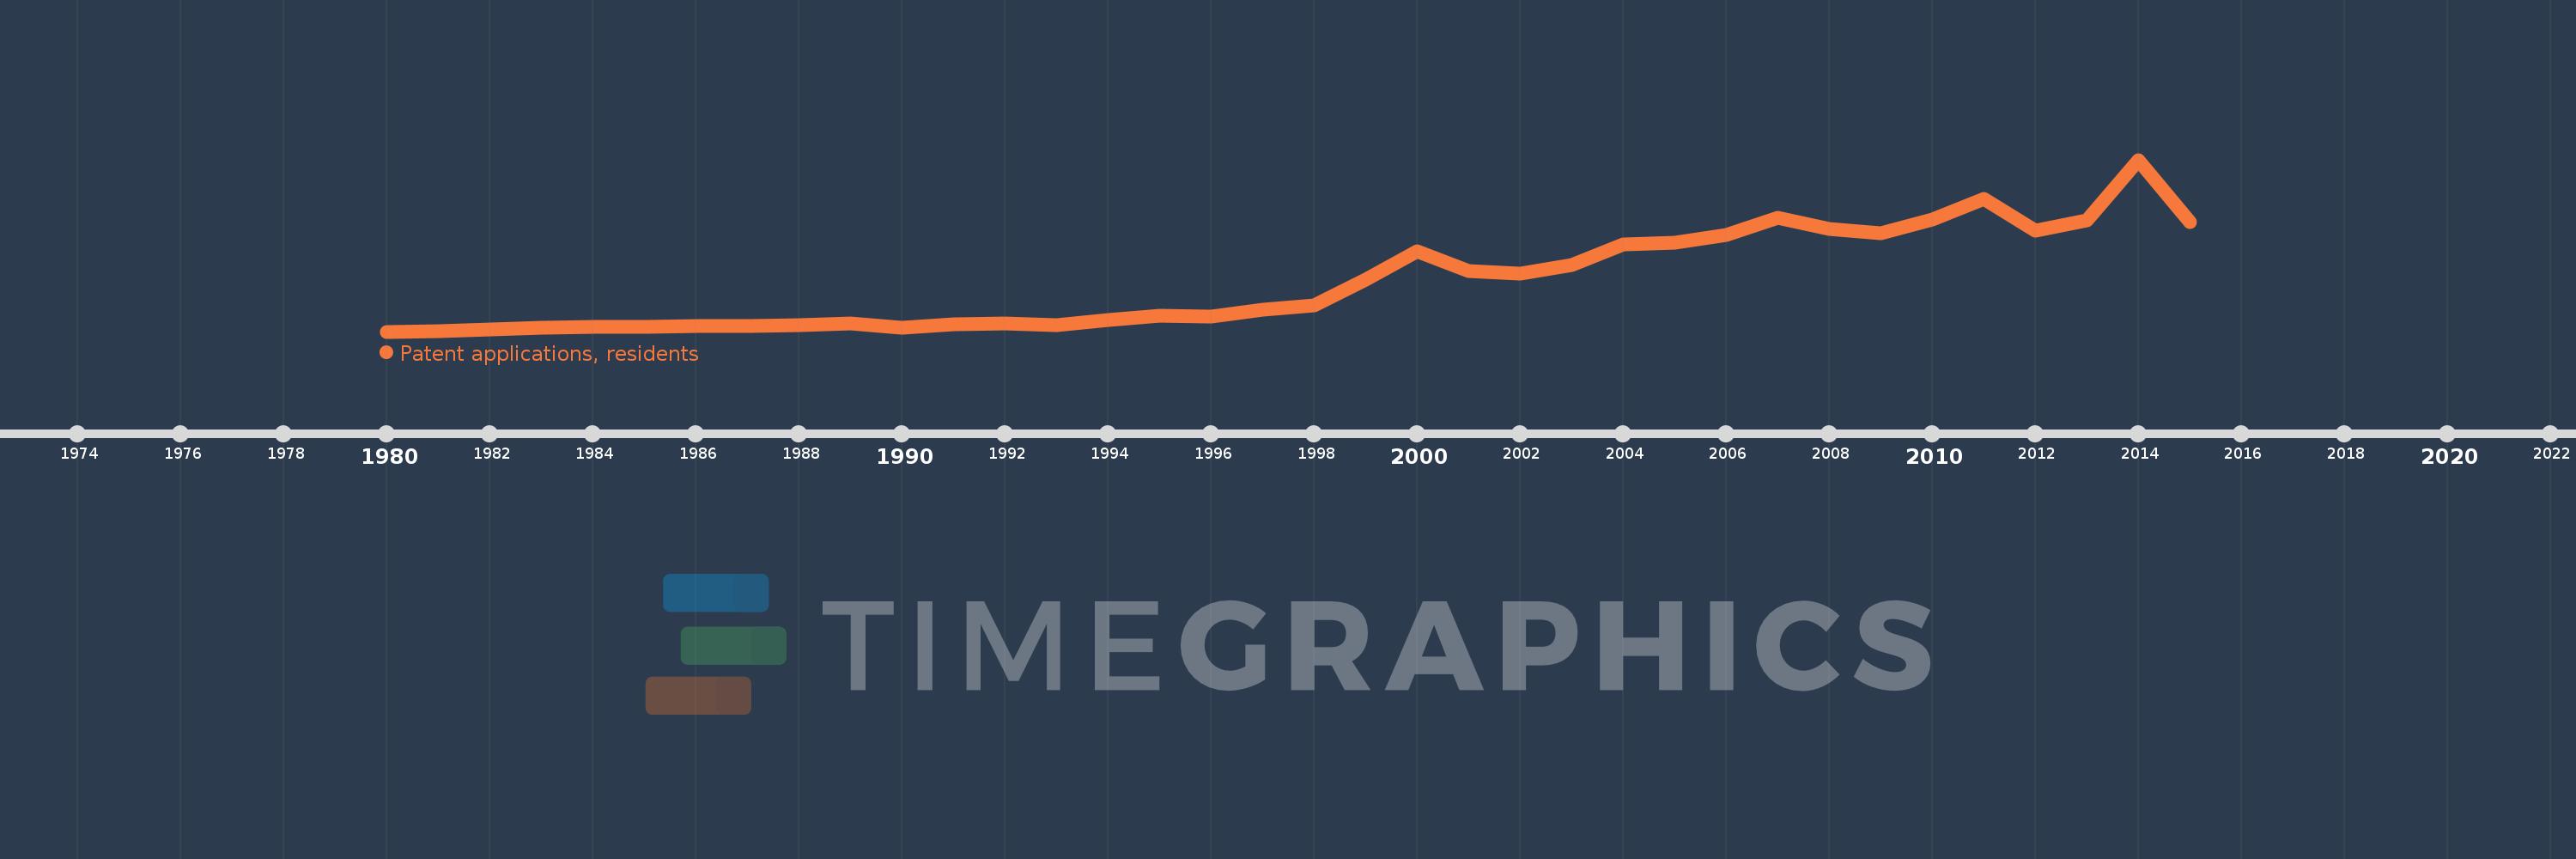
Patent applications, residents
2015,2014,2013,2012,2011,2010,2009,2008,2007,2006,2005,2004,2003,2002,2001,2000,1999,1998,1997,1996,1995,1994,1993,1992,1991,1990,1989,1988,1987,1986,1985,1984,1983,1982,1981,1980
This statistics in other country:
AlbaniaAlgeriaAngolaArab WorldArgentinaArmeniaArubaAustraliaAustriaAzerbaijanBahamas, TheBahrainBangladeshBarbadosBelarusBelgiumBelizeBhutanBoliviaBosnia and HerzegovinaBotswanaBrazilBrunei DarussalamBulgariaBurkina FasoBurundiCambodiaCanadaCaribbean small statesCentral Europe and the BalticsChileChinaColombiaCongo, Dem. Rep.Congo, Rep.Costa RicaCote d'IvoireCroatiaCubaCyprusCzech RepublicDenmarkDjiboutiDominican RepublicEarly-demographic dividendEast Asia & PacificEast Asia & Pacific (excluding high income)East Asia & Pacific (IDA & IBRD countries)EcuadorEgypt, Arab Rep.El SalvadorEstoniaEthiopiaEuro areaEurope & Central AsiaEurope & Central Asia (excluding high income)Europe & Central Asia (IDA & IBRD countries)European UnionFijiFinlandFranceGeorgiaGermanyGreeceGuatemalaGuyanaHaitiHigh incomeHondurasHong Kong SAR, ChinaHungaryIBRD onlyIcelandIDA & IBRD totalIDA blendIndiaIndonesiaIran, Islamic Rep.IraqIrelandIsraelItalyJamaicaJapanJordanKazakhstanKenyaKiribatiKorea, Dem. People’s Rep.Korea, Rep.KuwaitKyrgyz RepublicLao PDRLate-demographic dividendLatin America & Caribbean Latin America & Caribbean (excluding high income)Latin America & the Caribbean (IDA & IBRD countries)LatviaLebanonLesothoLiberiaLibyaLithuaniaLow & middle incomeLower middle incomeLuxembourgMacao SAR, ChinaMacedonia, FYRMadagascarMalawiMalaysiaMaliMaltaMauritiusMexicoMiddle East & North AfricaMiddle East & North Africa (excluding high income)Middle East & North Africa (IDA & IBRD countries)Middle incomeMoldovaMonacoMongoliaMontenegroMoroccoMozambiqueNamibiaNepalNetherlandsNew ZealandNicaraguaNigeriaNorth AmericaNorwayOECD membersPakistanPanamaPapua New GuineaParaguayPeruPhilippinesPolandPortugalPost-demographic dividendQatarRomaniaRussian FederationRwandaSamoaSaudi ArabiaSerbiaSierra LeoneSingaporeSlovak RepublicSloveniaSomaliaSouth AfricaSouth AsiaSouth Asia (IDA & IBRD)SpainSri LankaSudanSwazilandSwedenSwitzerlandSyrian Arab RepublicTajikistanTanzaniaThailandTrinidad and TobagoTunisiaTurkeyTurkmenistanUgandaUkraineUnited Arab EmiratesUnited KingdomUnited StatesUpper middle incomeUruguayUzbekistanVenezuela, RBVietnamWorldYemen, Rep.ZambiaZimbabwe Timeline:
This timeline shows a graph from 1980 to 2015 of Thailand. No data until 1979. Number of actual observations by date: 36.
Source name:
World Development Indicators
Source organization:
World Intellectual Property Organization (WIPO), WIPO Patent Report: Statistics on Worldwide Patent Activity. The International Bureau of WIPO assumes no responsibility with respect to the transformation of these data.
Categories, topics:
Science & Technology
Last updated:
apr 23, 2017
Indicators value changes by year
Maximum:
1.572K
jan 1, 2014
At the date of observation
Value
Absolute change
Change from previous value
jan 1, 1981
13.0
+6.0
85.71%
jan 1, 1982
26.0
+13.0
100.0%
jan 1, 1983
40.0
+14.0
53.85%
jan 1, 1984
48.0
+8.0
20.0%
jan 1, 1985
49.0
+1.0
2.08%
jan 1, 1986
55.0
+6.0
12.24%
jan 1, 1987
60.0
+5.0
9.09%
jan 1, 1988
68.0
+8.0
13.33%
jan 1, 1989
78.0
+10.0
14.71%
jan 1, 1990
43.0
-35.0
-44.87%
jan 1, 1991
73.0
+30.0
69.77%
jan 1, 1992
80.0
+7.0
9.59%
jan 1, 1993
67.0
-13.0
-16.25%
jan 1, 1994
110.0
+43.0
64.18%
jan 1, 1995
150.0
+40.0
36.36%
jan 1, 1996
145.0
-5.0
-3.33%
jan 1, 1997
203.0
+58.0
40.0%
jan 1, 1998
246.0
+43.0
21.18%
jan 1, 1999
479.0
+233.0
94.72%
jan 1, 2000
738.0
+259.0
54.07%
jan 1, 2001
561.0
-177.0
-23.98%
jan 1, 2002
534.0
-27.0
-4.81%
jan 1, 2003
615.0
+81.0
15.17%
jan 1, 2004
802.0
+187.0
30.41%
jan 1, 2005
819.0
+17.0
2.12%
jan 1, 2006
891.0
+72.0
8.79%
jan 1, 2007
1.04K
+149.0
16.72%
jan 1, 2008
945.0
-95.0
-9.13%
jan 1, 2009
902.0
-43.0
-4.55%
jan 1, 2010
1.025K
+123.0
13.64%
jan 1, 2011
1.214K
+189.0
18.44%
jan 1, 2012
927.0
-287.0
-23.64%
jan 1, 2013
1.02K
+93.0
10.03%
jan 1, 2014
1.572K
+552.0
54.12%
jan 1, 2015
1.006K
-566.0
-36.01%
Ranking of countries by current statistics by years


Comments: