29
/
en
AIzaSyAYiBZKx7MnpbEhh9jyipgxe19OcubqV5w
April 1, 2024
159774
Ireland
IRL
true
2
1
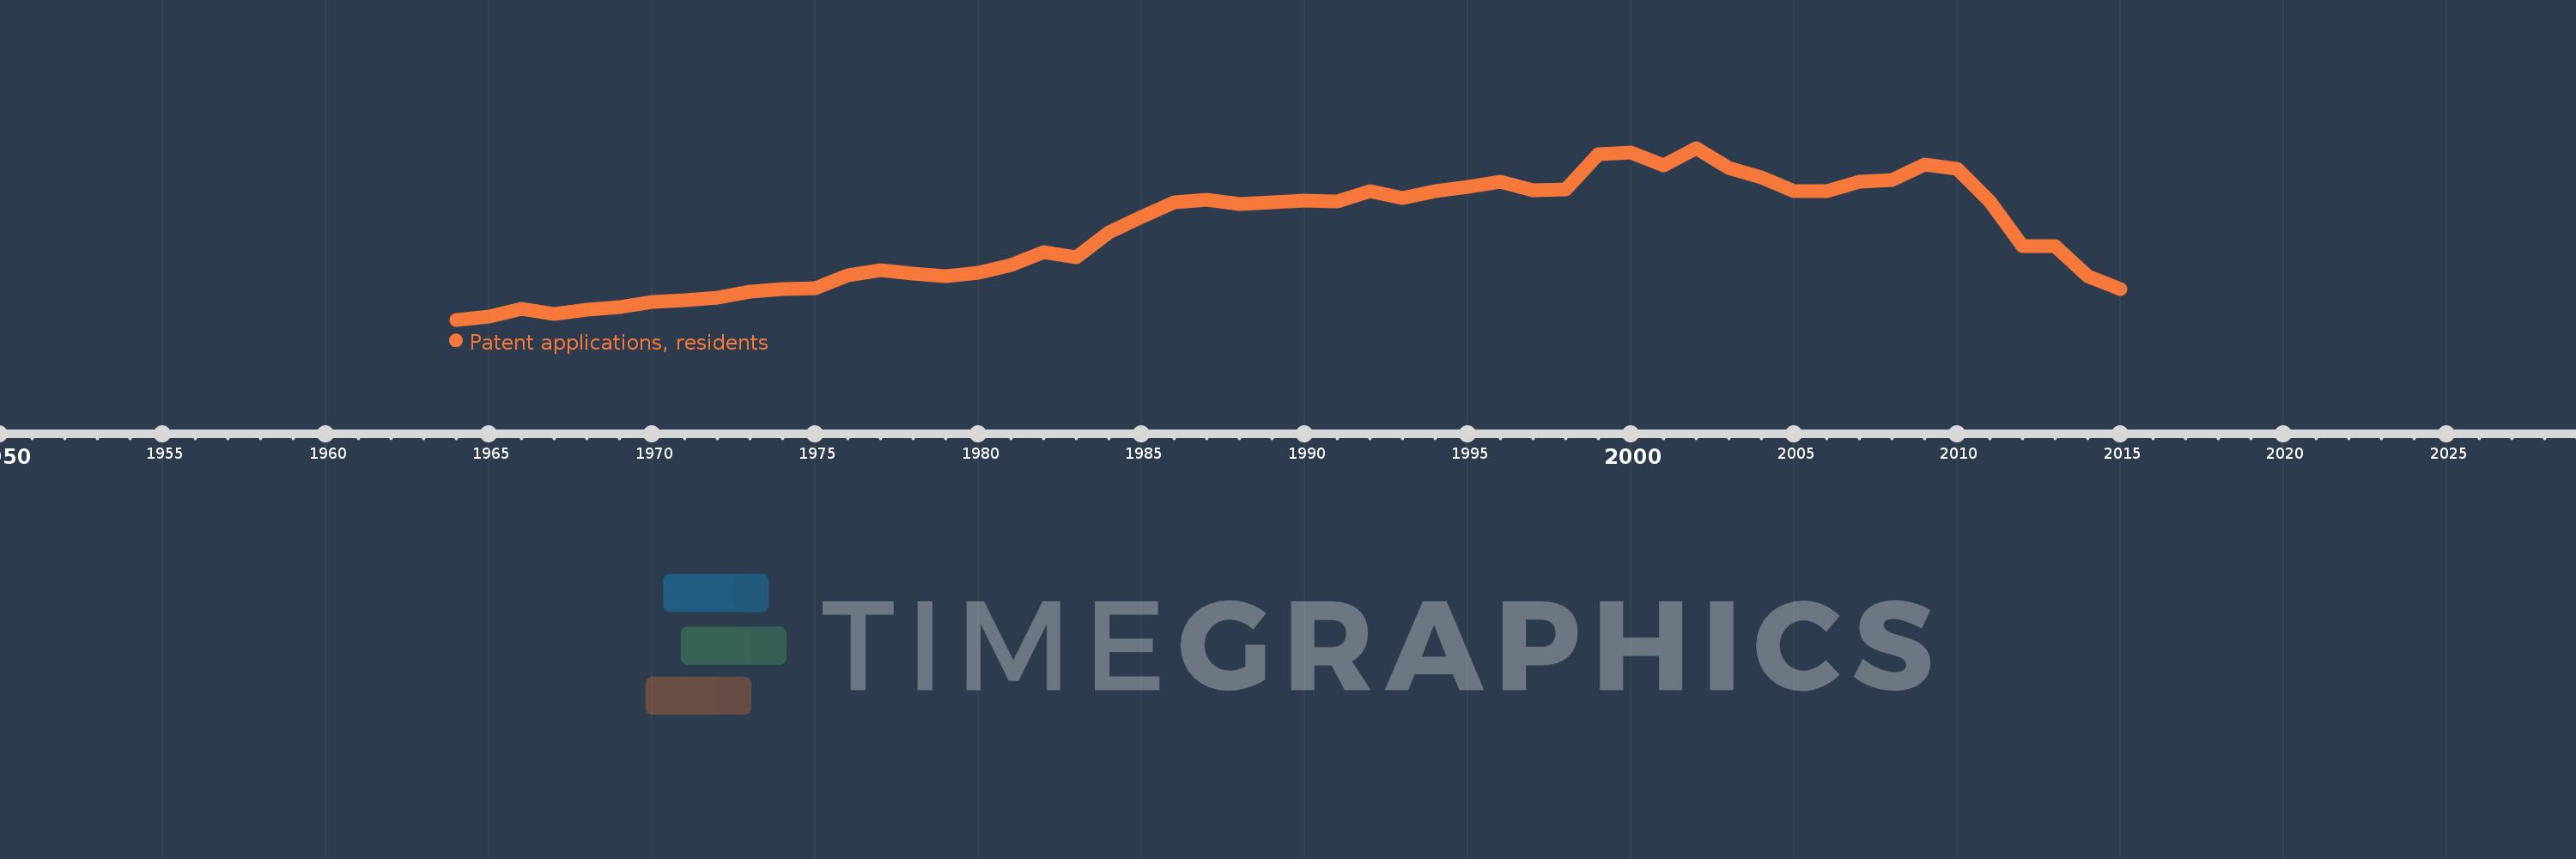
Patent applications, residents
2015,2014,2013,2012,2011,2010,2009,2008,2007,2006,2005,2004,2003,2002,2001,2000,1999,1998,1997,1996,1995,1994,1993,1992,1991,1990,1989,1988,1987,1986,1985,1984,1983,1982,1981,1980,1979,1978,1977,1976,1975,1974,1973,1972,1971,1970,1969,1968,1967,1966,1965,1964
This statistics in other country:
AlbaniaAlgeriaAngolaArab WorldArgentinaArmeniaArubaAustraliaAustriaAzerbaijanBahamas, TheBahrainBangladeshBarbadosBelarusBelgiumBelizeBhutanBoliviaBosnia and HerzegovinaBotswanaBrazilBrunei DarussalamBulgariaBurkina FasoBurundiCambodiaCanadaCaribbean small statesCentral Europe and the BalticsChileChinaColombiaCongo, Dem. Rep.Congo, Rep.Costa RicaCote d'IvoireCroatiaCubaCyprusCzech RepublicDenmarkDjiboutiDominican RepublicEarly-demographic dividendEast Asia & PacificEast Asia & Pacific (excluding high income)East Asia & Pacific (IDA & IBRD countries)EcuadorEgypt, Arab Rep.El SalvadorEstoniaEthiopiaEuro areaEurope & Central AsiaEurope & Central Asia (excluding high income)Europe & Central Asia (IDA & IBRD countries)European UnionFijiFinlandFranceGeorgiaGermanyGreeceGuatemalaGuyanaHaitiHigh incomeHondurasHong Kong SAR, ChinaHungaryIBRD onlyIcelandIDA & IBRD totalIDA blendIndiaIndonesiaIran, Islamic Rep.IraqIrelandIsraelItalyJamaicaJapanJordanKazakhstanKenyaKiribatiKorea, Dem. People’s Rep.Korea, Rep.KuwaitKyrgyz RepublicLao PDRLate-demographic dividendLatin America & Caribbean Latin America & Caribbean (excluding high income)Latin America & the Caribbean (IDA & IBRD countries)LatviaLebanonLesothoLiberiaLibyaLithuaniaLow & middle incomeLower middle incomeLuxembourgMacao SAR, ChinaMacedonia, FYRMadagascarMalawiMalaysiaMaliMaltaMauritiusMexicoMiddle East & North AfricaMiddle East & North Africa (excluding high income)Middle East & North Africa (IDA & IBRD countries)Middle incomeMoldovaMonacoMongoliaMontenegroMoroccoMozambiqueNamibiaNepalNetherlandsNew ZealandNicaraguaNigeriaNorth AmericaNorwayOECD membersPakistanPanamaPapua New GuineaParaguayPeruPhilippinesPolandPortugalPost-demographic dividendQatarRomaniaRussian FederationRwandaSamoaSaudi ArabiaSerbiaSierra LeoneSingaporeSlovak RepublicSloveniaSomaliaSouth AfricaSouth AsiaSouth Asia (IDA & IBRD)SpainSri LankaSudanSwazilandSwedenSwitzerlandSyrian Arab RepublicTajikistanTanzaniaThailandTrinidad and TobagoTunisiaTurkeyTurkmenistanUgandaUkraineUnited Arab EmiratesUnited KingdomUnited StatesUpper middle incomeUruguayUzbekistanVenezuela, RBVietnamWorldYemen, Rep.ZambiaZimbabwe Timeline:
This timeline shows a graph from 1964 to 2015 of Ireland. No data until 1963. Number of actual observations by date: 52.
Source name:
World Development Indicators
Source organization:
World Intellectual Property Organization (WIPO), WIPO Patent Report: Statistics on Worldwide Patent Activity. The International Bureau of WIPO assumes no responsibility with respect to the transformation of these data.
Categories, topics:
Science & Technology
Last updated:
apr 23, 2017
Indicators value changes by year
Maximum:
1.019K
jan 1, 2002
At the date of observation
Value
Absolute change
Change from previous value
jan 1, 1964
99.0
+99.0
0.0%
jan 1, 1965
117.0
+18.0
18.18%
jan 1, 1966
157.0
+40.0
34.19%
jan 1, 1967
130.0
-27.0
-17.2%
jan 1, 1968
152.0
+22.0
16.92%
jan 1, 1969
168.0
+16.0
10.53%
jan 1, 1970
195.0
+27.0
16.07%
jan 1, 1971
205.0
+10.0
5.13%
jan 1, 1972
219.0
+14.0
6.83%
jan 1, 1973
249.0
+30.0
13.7%
jan 1, 1974
264.0
+15.0
6.02%
jan 1, 1975
266.0
+2.0
0.76%
jan 1, 1976
339.0
+73.0
27.44%
jan 1, 1977
363.0
+24.0
7.08%
jan 1, 1978
348.0
-15.0
-4.13%
jan 1, 1979
333.0
-15.0
-4.31%
jan 1, 1980
352.0
+19.0
5.71%
jan 1, 1981
394.0
+42.0
11.93%
jan 1, 1982
461.0
+67.0
17.01%
jan 1, 1983
434.0
-27.0
-5.86%
jan 1, 1984
567.0
+133.0
30.65%
jan 1, 1985
651.0
+84.0
14.81%
jan 1, 1986
726.0
+75.0
11.52%
jan 1, 1987
743.0
+17.0
2.34%
jan 1, 1988
719.0
-24.0
-3.23%
jan 1, 1989
727.0
+8.0
1.11%
jan 1, 1990
736.0
+9.0
1.24%
jan 1, 1991
734.0
-2.0
-0.27%
jan 1, 1992
786.0
+52.0
7.08%
jan 1, 1993
752.0
-34.0
-4.33%
jan 1, 1994
788.0
+36.0
4.79%
jan 1, 1995
811.0
+23.0
2.92%
jan 1, 1996
840.0
+29.0
3.58%
jan 1, 1997
793.0
-47.0
-5.6%
jan 1, 1998
796.0
+3.0
0.38%
jan 1, 1999
985.0
+189.0
23.74%
jan 1, 2000
996.0
+11.0
1.12%
jan 1, 2001
925.0
-71.0
-7.13%
jan 1, 2002
1.019K
+94.0
10.16%
jan 1, 2003
914.0
-105.0
-10.3%
jan 1, 2004
862.0
-52.0
-5.69%
jan 1, 2005
787.0
-75.0
-8.7%
jan 1, 2006
789.0
+2.0
0.25%
jan 1, 2007
838.0
+49.0
6.21%
jan 1, 2008
847.0
+9.0
1.07%
jan 1, 2009
931.0
+84.0
9.92%
jan 1, 2010
908.0
-23.0
-2.47%
jan 1, 2011
733.0
-175.0
-19.27%
jan 1, 2012
494.0
-239.0
-32.61%
jan 1, 2013
492.0
-2.0
-0.4%
jan 1, 2014
333.0
-159.0
-32.32%
jan 1, 2015
263.0
-70.0
-21.02%
Ranking of countries by current statistics by years


Comments: