29
/
en
AIzaSyAYiBZKx7MnpbEhh9jyipgxe19OcubqV5w
April 1, 2024
236893
Serbia
SRB
true
2
1
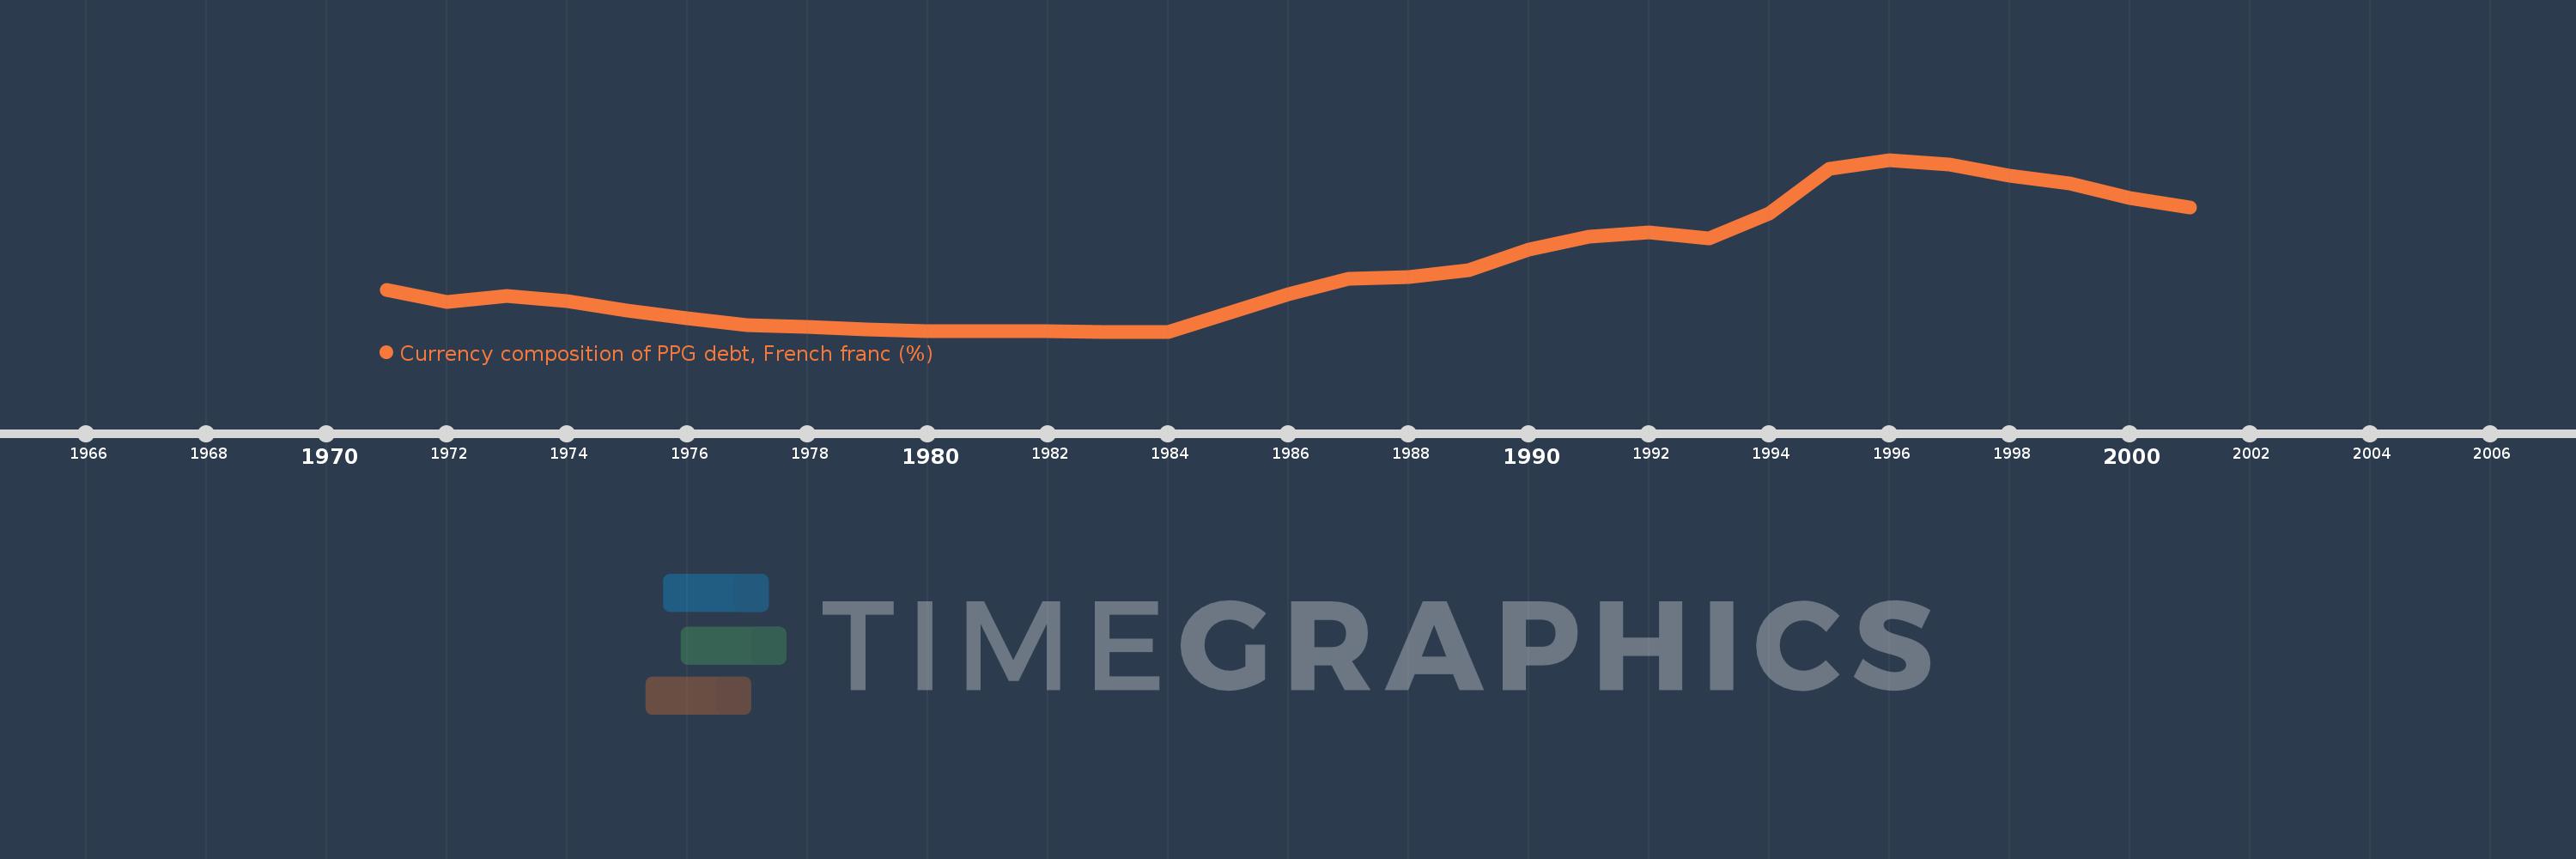
Currency composition of PPG debt, French franc (%)
2001,2000,1999,1998,1997,1996,1995,1994,1993,1992,1991,1990,1989,1988,1987,1986,1985,1984,1983,1982,1981,1980,1979,1978,1977,1976,1975,1974,1973,1972,1971
This statistics in other country:
Timeline:
This timeline shows a graph from 1971 to 2001 of Serbia. No data until 1970. Number of actual observations by date: 31.
Source name:
World Development Indicators
Source organization:
World Bank, International Debt Statistics.
Categories, topics:
External Debt
Last updated:
apr 23, 2017
Indicators value changes by year
At the date of observation
Value
Absolute change
Change from previous value
jan 1, 1971
1.915
+1.915
0.0%
jan 1, 1972
1.365
-0.549
-28.68%
jan 1, 1973
1.661
+0.296
21.64%
jan 1, 1974
1.417
-0.244
-14.7%
jan 1, 1975
0.964
-0.453
-31.99%
jan 1, 1976
0.615
-0.348
-36.16%
jan 1, 1977
0.317
-0.298
-48.51%
jan 1, 1978
0.222
-0.095
-30.0%
jan 1, 1979
0.089
-0.132
-59.63%
jan 1, 1980
0.019
-0.07
-78.32%
jan 1, 1981
0.003
-0.016
-84.54%
jan 1, 1982
0.001
-0.002
-70.0%
jan 1, 1983
0.0
-0.001
-100.0%
jan 1, 1986
1.731
+0.861
98.95%
jan 1, 1987
2.436
+0.705
40.72%
jan 1, 1988
2.524
+0.089
3.63%
jan 1, 1989
2.833
+0.309
12.23%
jan 1, 1990
3.791
+0.958
33.81%
jan 1, 1991
4.39
+0.599
15.8%
jan 1, 1992
4.597
+0.207
4.72%
jan 1, 1993
4.331
-0.266
-5.79%
jan 1, 1994
5.463
+1.132
26.14%
jan 1, 1995
7.543
+2.08
38.07%
jan 1, 1996
7.971
+0.427
5.66%
jan 1, 1997
7.757
-0.214
-2.68%
jan 1, 1998
7.248
-0.509
-6.56%
jan 1, 1999
6.884
-0.364
-5.02%
jan 1, 2000
6.182
-0.702
-10.19%
jan 1, 2001
5.741
-0.441
-7.13%
Ranking of countries by current statistics by years


Comments: