29
/
en
AIzaSyAYiBZKx7MnpbEhh9jyipgxe19OcubqV5w
April 1, 2024
105802
China
CHN
true
2
1
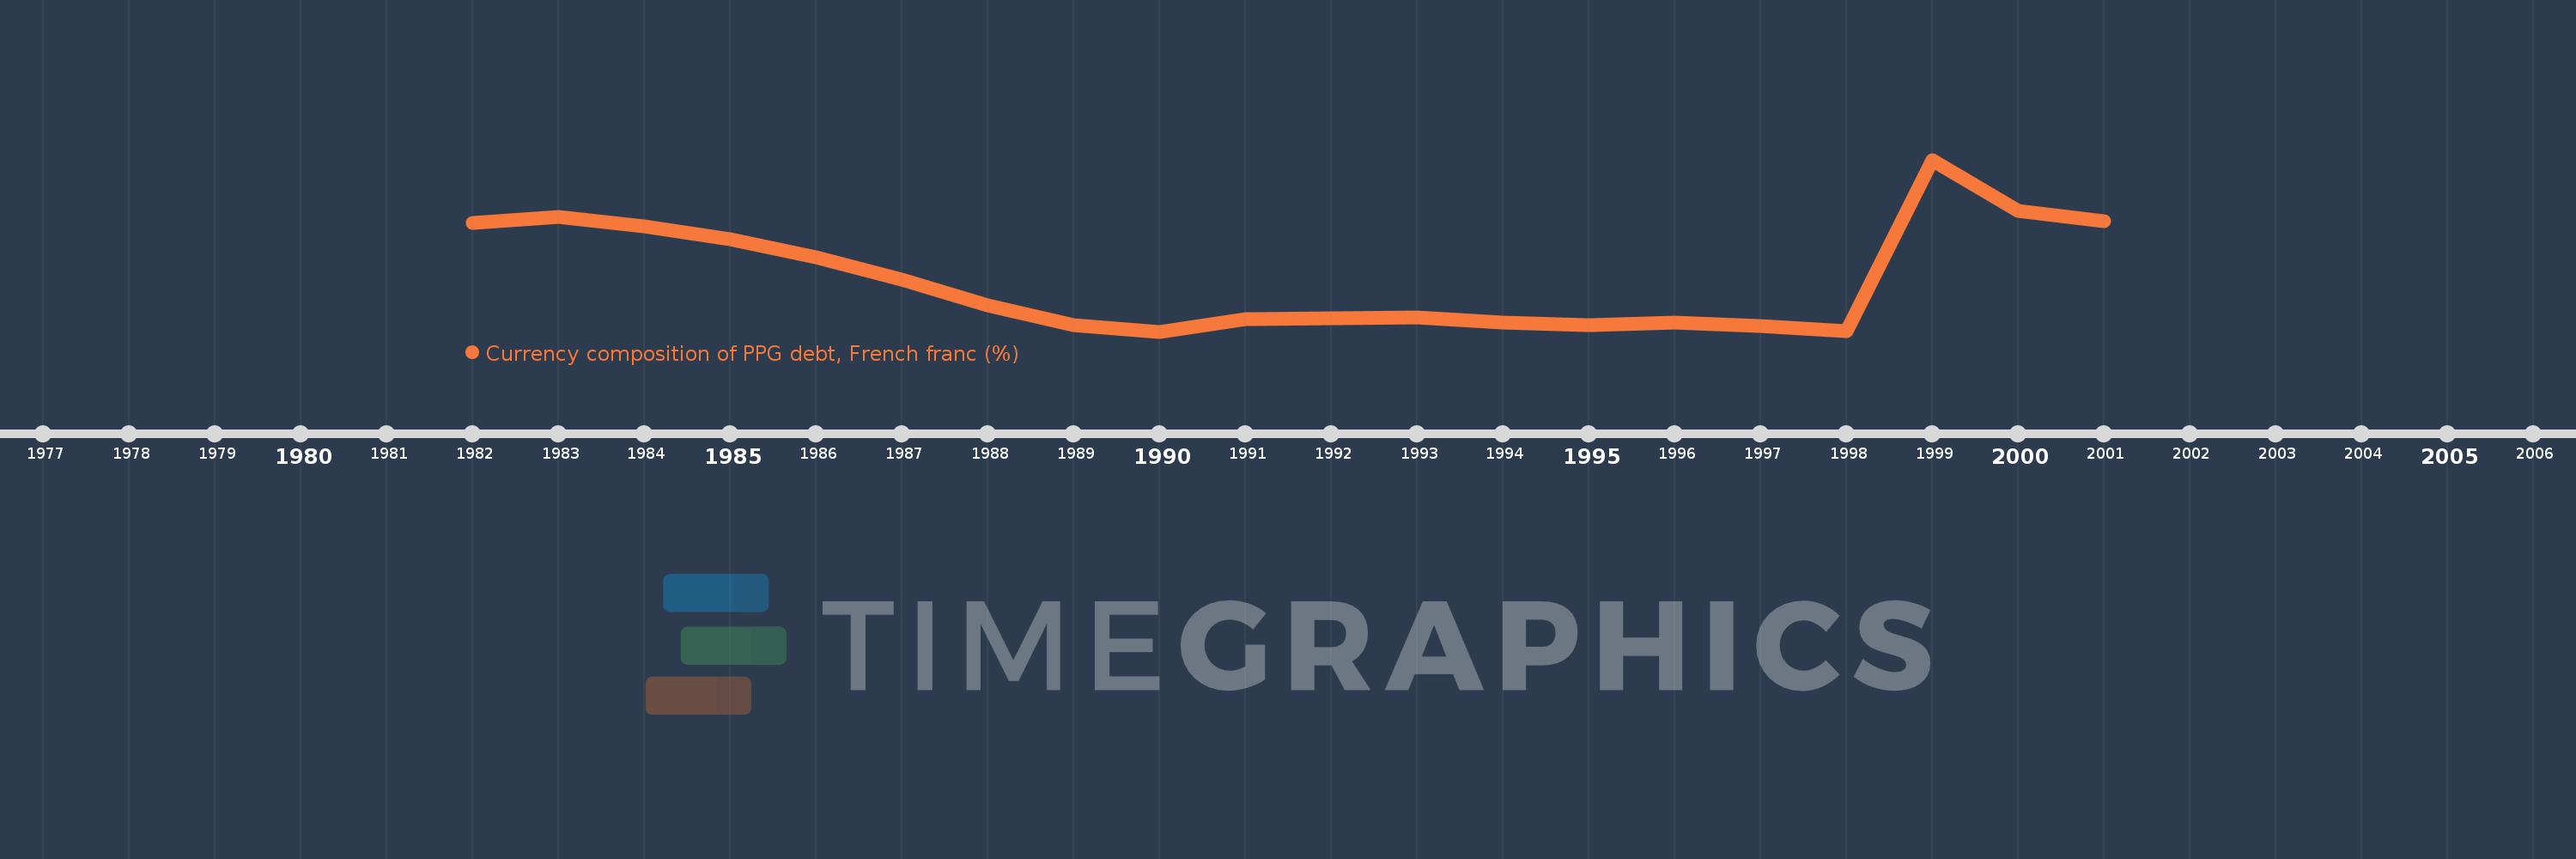
Currency composition of PPG debt, French franc (%)
2001,2000,1999,1998,1997,1996,1995,1994,1993,1992,1991,1990,1989,1988,1987,1986,1985,1984,1983,1982
This statistics in other country:
Timeline:
This timeline shows a graph from 1982 to 2001 of China. No data until 1981. Number of actual observations by date: 20.
Source name:
World Development Indicators
Source organization:
World Bank, International Debt Statistics.
Categories, topics:
External Debt
Last updated:
apr 23, 2017
Indicators value changes by year
At the date of observation
Value
Absolute change
Change from previous value
jan 1, 1982
1.875
+1.875
0.0%
jan 1, 1983
1.961
+0.086
4.58%
jan 1, 1984
1.813
-0.148
-7.57%
jan 1, 1985
1.613
-0.2
-11.0%
jan 1, 1986
1.328
-0.286
-17.71%
jan 1, 1987
0.988
-0.34
-25.62%
jan 1, 1988
0.574
-0.414
-41.87%
jan 1, 1989
0.275
-0.299
-52.04%
jan 1, 1990
0.168
-0.108
-39.12%
jan 1, 1991
0.363
+0.195
116.41%
jan 1, 1992
0.371
+0.009
2.4%
jan 1, 1993
0.389
+0.018
4.71%
jan 1, 1994
0.313
-0.076
-19.52%
jan 1, 1995
0.273
-0.04
-12.91%
jan 1, 1996
0.308
+0.035
12.88%
jan 1, 1997
0.251
-0.056
-18.33%
jan 1, 1998
0.174
-0.077
-30.64%
jan 1, 1999
2.863
+2.688
1.54K%
jan 1, 2000
2.055
-0.808
-28.22%
jan 1, 2001
1.895
-0.159
-7.75%
Ranking of countries by current statistics by years


Comments: