29
/
en
AIzaSyAYiBZKx7MnpbEhh9jyipgxe19OcubqV5w
April 1, 2024
48861
Middle East & North Africa (excluding high income)
MNA
false
2
1
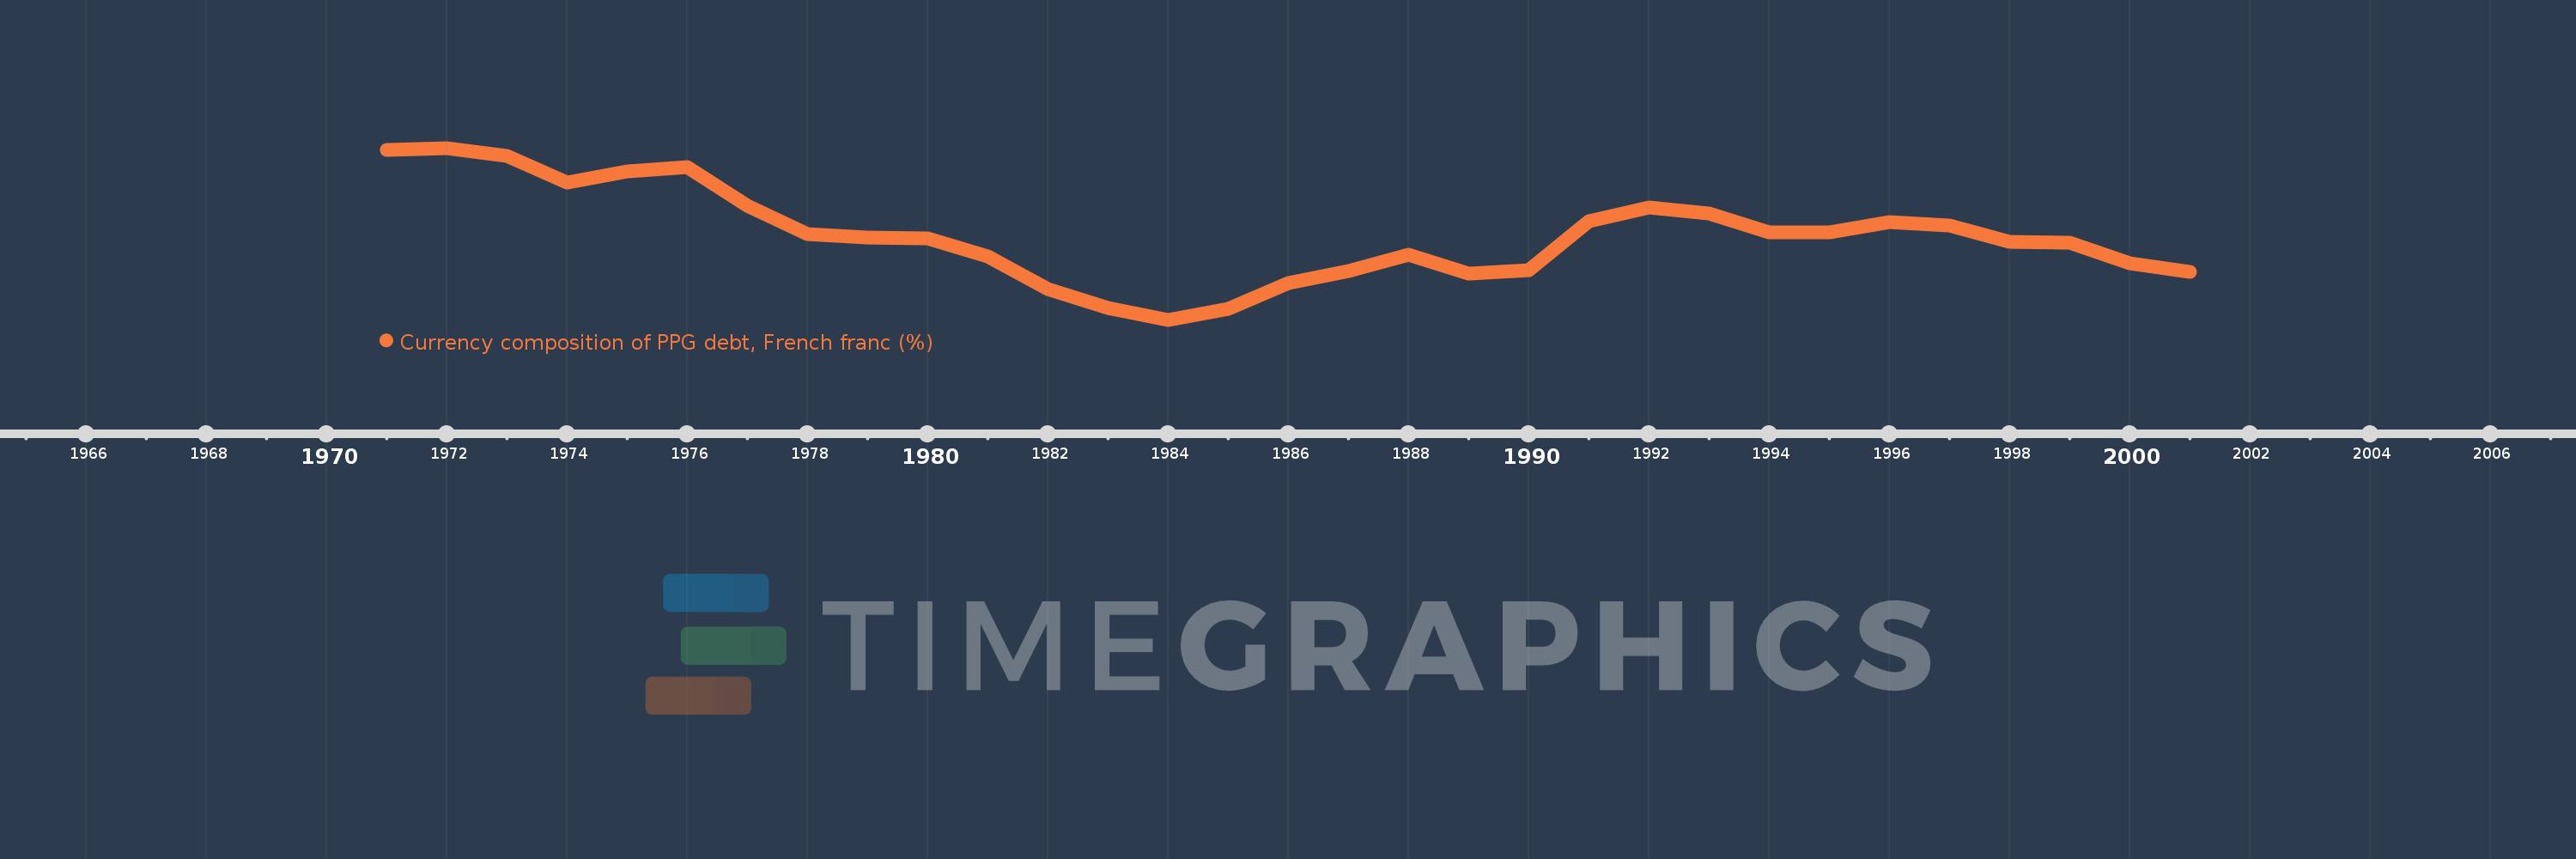
Currency composition of PPG debt, French franc (%)
2001,2000,1999,1998,1997,1996,1995,1994,1993,1992,1991,1990,1989,1988,1987,1986,1985,1984,1983,1982,1981,1980,1979,1978,1977,1976,1975,1974,1973,1972,1971
This statistics in other country:
Timeline:
This timeline shows a graph from 1971 to 2001 of Middle East & North Africa (excluding high income). No data until 1970. Number of actual observations by date: 31.
Source name:
World Development Indicators
Source organization:
World Bank, International Debt Statistics.
Categories, topics:
External Debt
Last updated:
apr 23, 2017
Indicators value changes by year
Maximum:
18.803
jan 1, 1972
At the date of observation
Value
Absolute change
Change from previous value
jan 1, 1971
18.664
+18.664
0.0%
jan 1, 1972
18.803
+0.139
0.75%
jan 1, 1973
18.283
-0.52
-2.77%
jan 1, 1974
16.479
-1.804
-9.87%
jan 1, 1975
17.211
+0.732
4.44%
jan 1, 1976
17.532
+0.32
1.86%
jan 1, 1977
14.897
-2.635
-15.03%
jan 1, 1978
12.988
-1.909
-12.81%
jan 1, 1979
12.758
-0.231
-1.77%
jan 1, 1980
12.714
-0.044
-0.35%
jan 1, 1981
11.453
-1.26
-9.91%
jan 1, 1982
9.255
-2.198
-19.19%
jan 1, 1983
8.011
-1.244
-13.44%
jan 1, 1984
7.189
-0.823
-10.27%
jan 1, 1985
7.923
+0.735
10.22%
jan 1, 1986
9.697
+1.774
22.39%
jan 1, 1987
10.496
+0.798
8.23%
jan 1, 1988
11.608
+1.112
10.6%
jan 1, 1989
10.293
-1.314
-11.32%
jan 1, 1990
10.55
+0.256
2.49%
jan 1, 1991
13.869
+3.32
31.47%
jan 1, 1992
14.807
+0.938
6.76%
jan 1, 1993
14.386
-0.421
-2.84%
jan 1, 1994
13.119
-1.267
-8.81%
jan 1, 1995
13.075
-0.045
-0.34%
jan 1, 1996
13.805
+0.731
5.59%
jan 1, 1997
13.559
-0.246
-1.78%
jan 1, 1998
12.465
-1.094
-8.07%
jan 1, 1999
12.378
-0.087
-0.7%
jan 1, 2000
11.012
-1.366
-11.04%
jan 1, 2001
10.423
-0.589
-5.34%
Ranking of countries by current statistics by years


Comments: