29
/
en
AIzaSyAYiBZKx7MnpbEhh9jyipgxe19OcubqV5w
April 1, 2024
146703
Guinea-Bissau
GNB
true
2
1
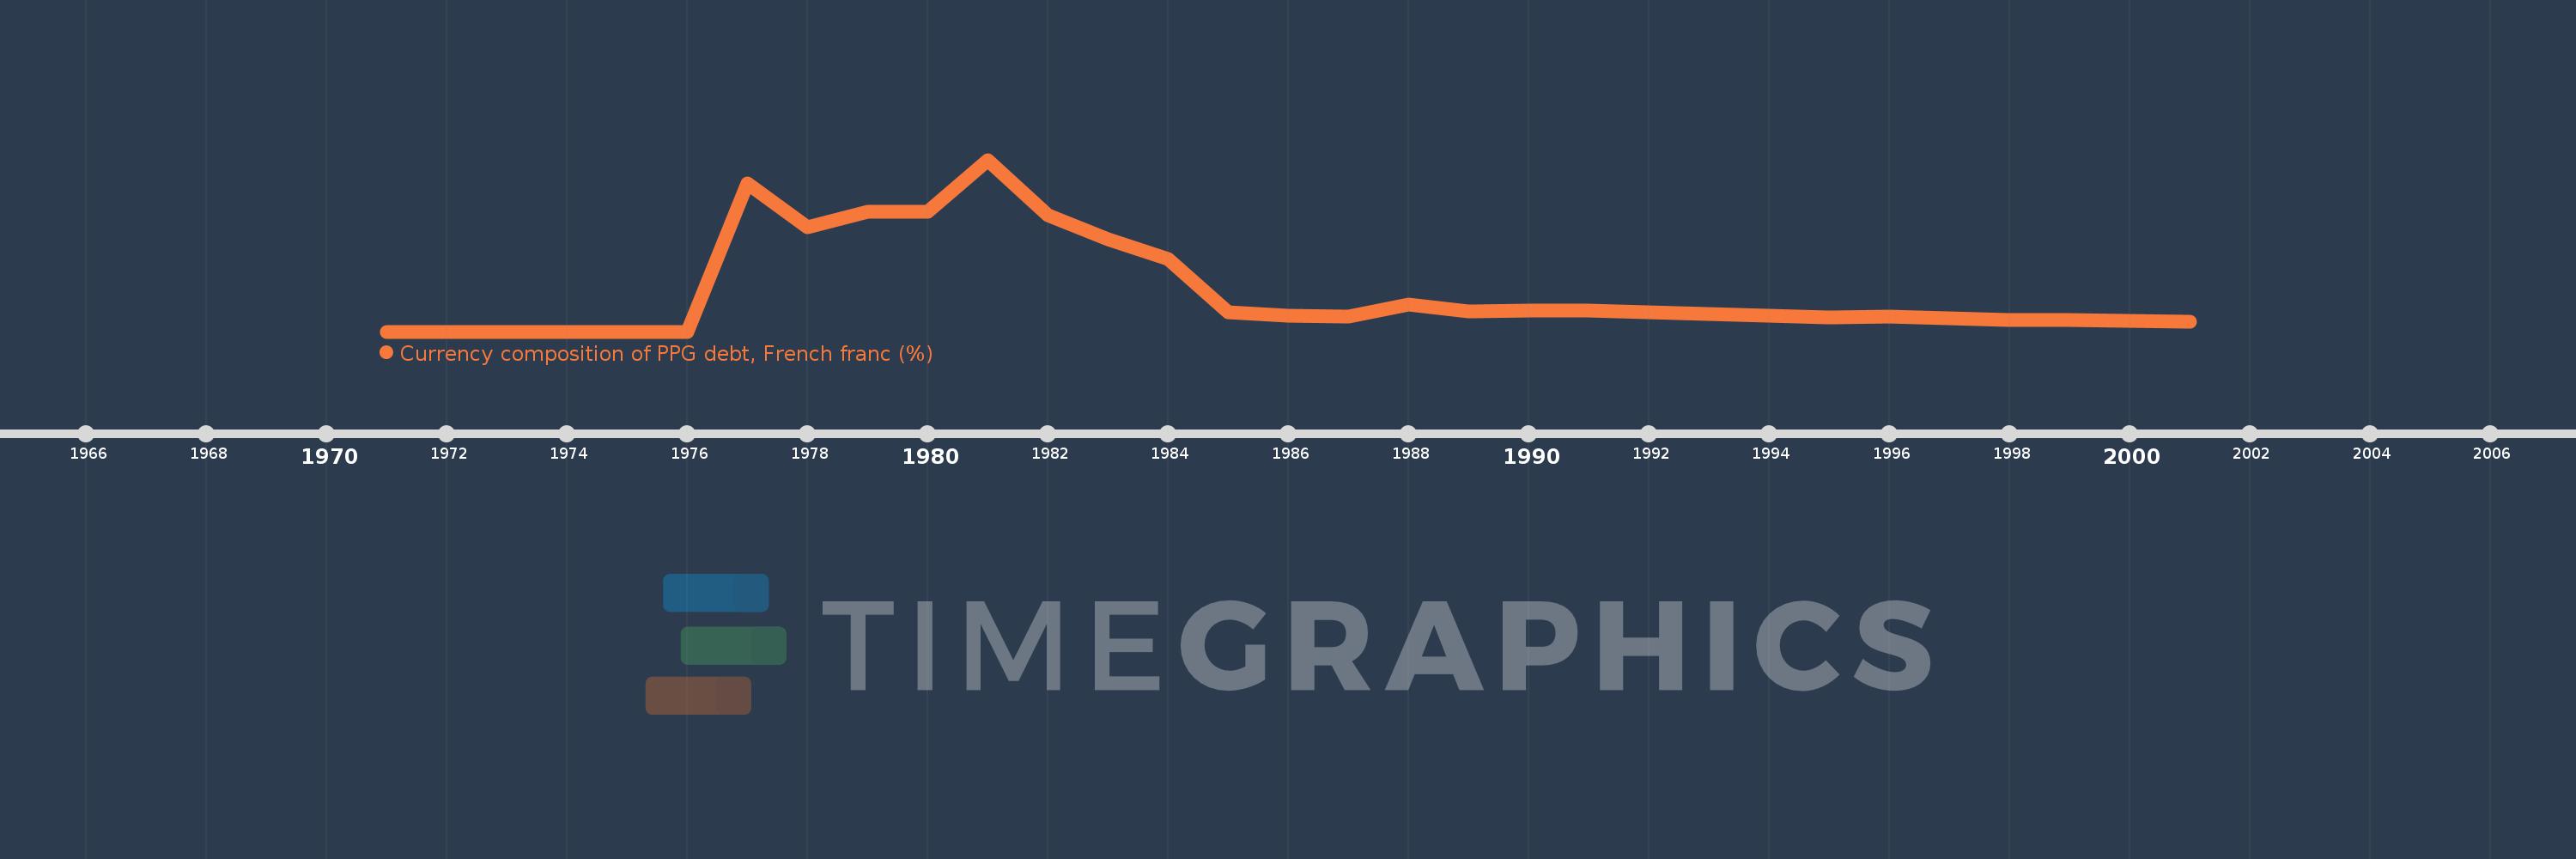
Currency composition of PPG debt, French franc (%)
2001,2000,1999,1998,1997,1996,1995,1994,1993,1992,1991,1990,1989,1988,1987,1986,1985,1984,1983,1982,1981,1980,1979,1978,1977,1976,1975,1974,1973,1972,1971
This statistics in other country:
Timeline:
This timeline shows a graph from 1971 to 2001 of Guinea-Bissau. No data until 1970. Number of actual observations by date: 31.
Source name:
World Development Indicators
Source organization:
World Bank, International Debt Statistics.
Categories, topics:
External Debt
Last updated:
apr 23, 2017
Indicators value changes by year
Maximum:
15.076
jan 1, 1981
At the date of observation
Value
Absolute change
Change from previous value
jan 1, 1977
12.978
+12.978
%
jan 1, 1978
9.13
-3.847
-29.65%
jan 1, 1979
10.537
+1.407
15.41%
jan 1, 1980
10.521
-0.016
-0.15%
jan 1, 1981
15.076
+4.556
43.3%
jan 1, 1982
10.226
-4.85
-32.17%
jan 1, 1983
8.088
-2.138
-20.91%
jan 1, 1984
6.335
-1.753
-21.67%
jan 1, 1985
1.719
-4.616
-72.86%
jan 1, 1986
1.385
-0.335
-19.48%
jan 1, 1987
1.303
-0.082
-5.92%
jan 1, 1988
2.386
+1.083
83.18%
jan 1, 1989
1.788
-0.598
-25.08%
jan 1, 1990
1.856
+0.068
3.82%
jan 1, 1991
1.839
-0.017
-0.91%
jan 1, 1992
1.698
-0.141
-7.68%
jan 1, 1993
1.565
-0.133
-7.82%
jan 1, 1994
1.421
-0.144
-9.21%
jan 1, 1995
1.238
-0.182
-12.84%
jan 1, 1996
1.308
+0.07
5.64%
jan 1, 1997
1.141
-0.167
-12.77%
jan 1, 1998
1.018
-0.123
-10.79%
jan 1, 1999
1.034
+0.016
1.58%
jan 1, 2000
0.933
-0.101
-9.8%
jan 1, 2001
0.88
-0.052
-5.62%
Ranking of countries by current statistics by years


Comments: