29
/
en
AIzaSyAYiBZKx7MnpbEhh9jyipgxe19OcubqV5w
April 1, 2024
250619
St. Lucia
LCA
true
2
1
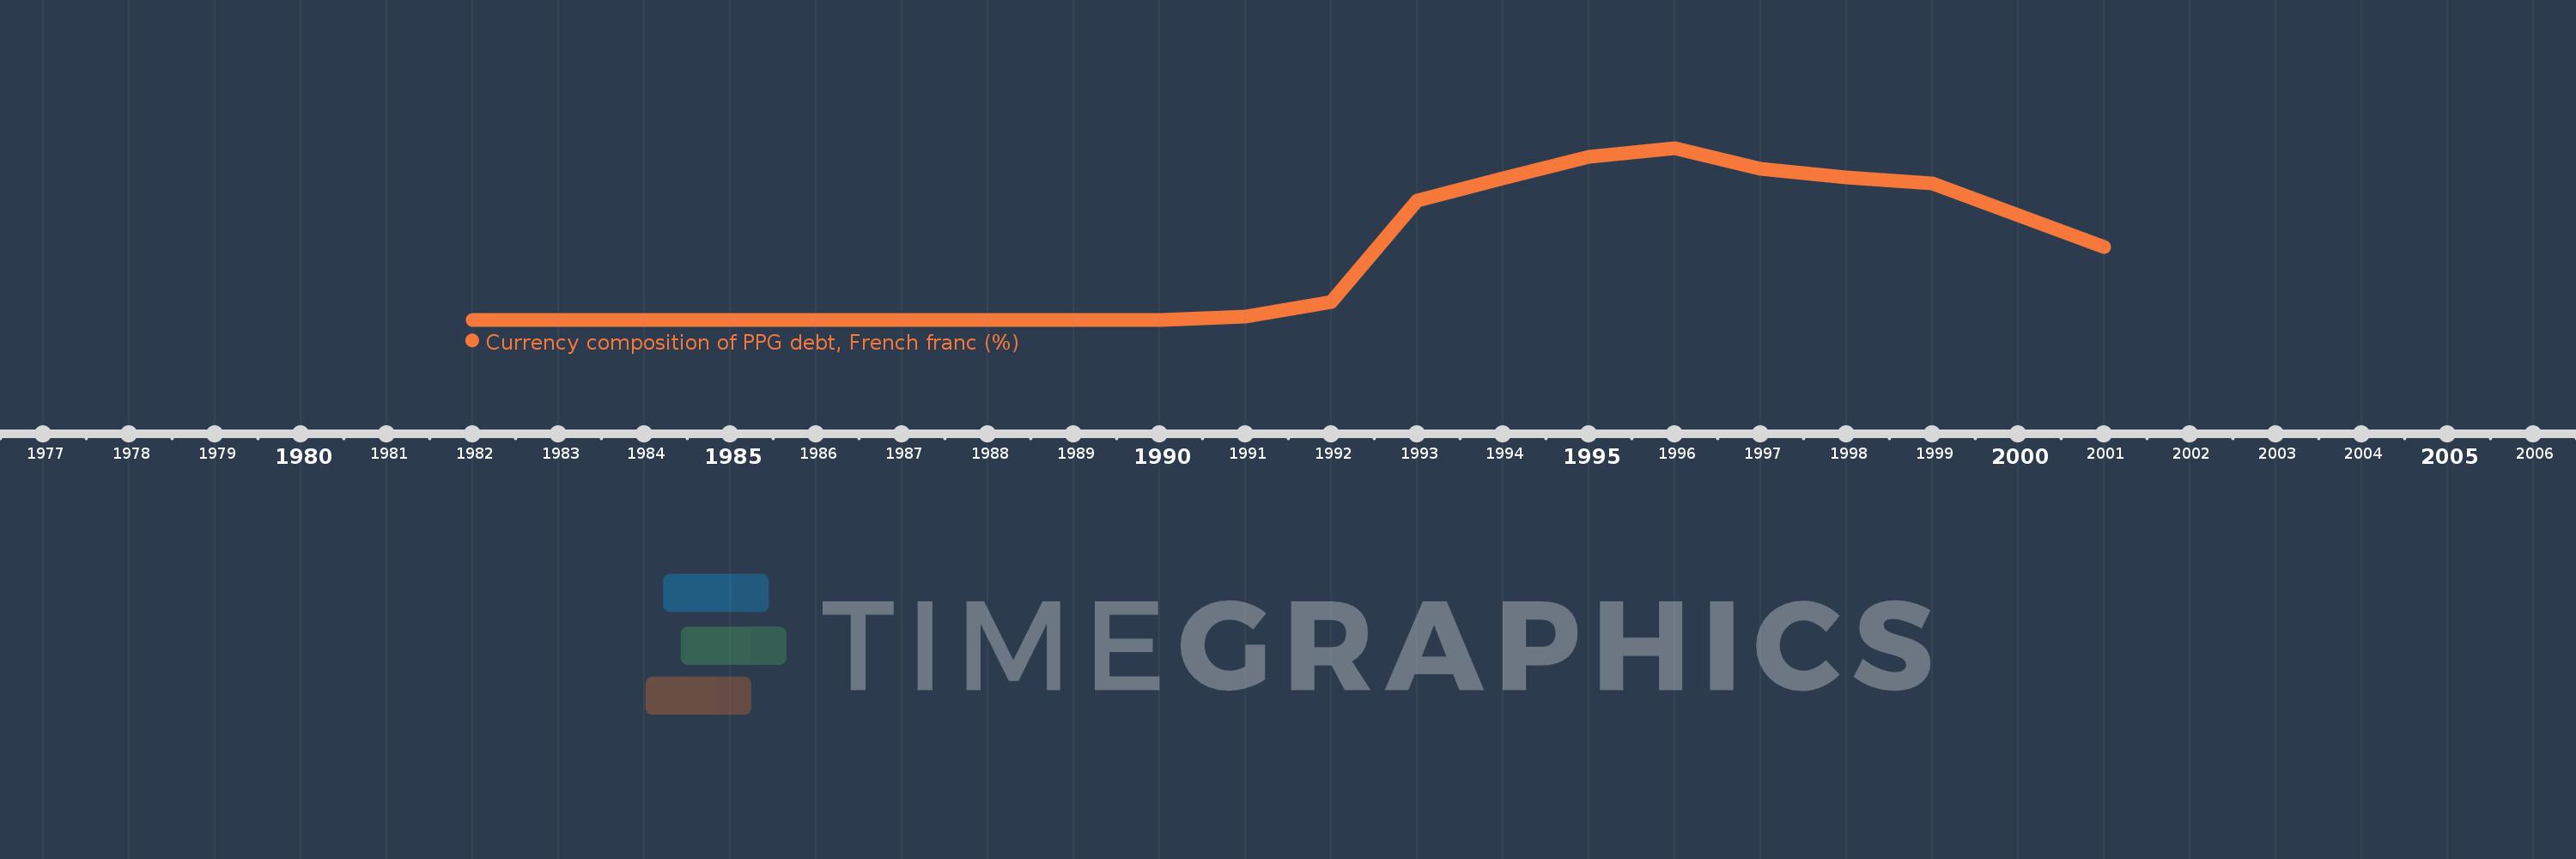
Currency composition of PPG debt, French franc (%)
2001,2000,1999,1998,1997,1996,1995,1994,1993,1992,1991,1990,1989,1988,1987,1986,1985,1984,1983,1982
This statistics in other country:
Timeline:
This timeline shows a graph from 1982 to 2001 of St. Lucia. No data until 1981. Number of actual observations by date: 20.
Source name:
World Development Indicators
Source organization:
World Bank, International Debt Statistics.
Categories, topics:
External Debt
Last updated:
apr 23, 2017
Indicators value changes by year
Maximum:
15.901
jan 1, 1996
At the date of observation
Value
Absolute change
Change from previous value
jan 1, 1991
0.284
+0.284
%
jan 1, 1992
1.665
+1.381
486.2%
jan 1, 1993
11.007
+9.341
560.89%
jan 1, 1994
13.107
+2.101
19.09%
jan 1, 1995
15.07
+1.963
14.98%
jan 1, 1996
15.901
+0.83
5.51%
jan 1, 1997
13.994
-1.906
-11.99%
jan 1, 1998
13.196
-0.799
-5.71%
jan 1, 1999
12.593
-0.603
-4.57%
jan 1, 2000
9.69
-2.903
-23.06%
jan 1, 2001
6.738
-2.952
-30.46%
Ranking of countries by current statistics by years


Comments: