29
/
en
AIzaSyAYiBZKx7MnpbEhh9jyipgxe19OcubqV5w
April 1, 2024
231503
Rwanda
RWA
true
2
1
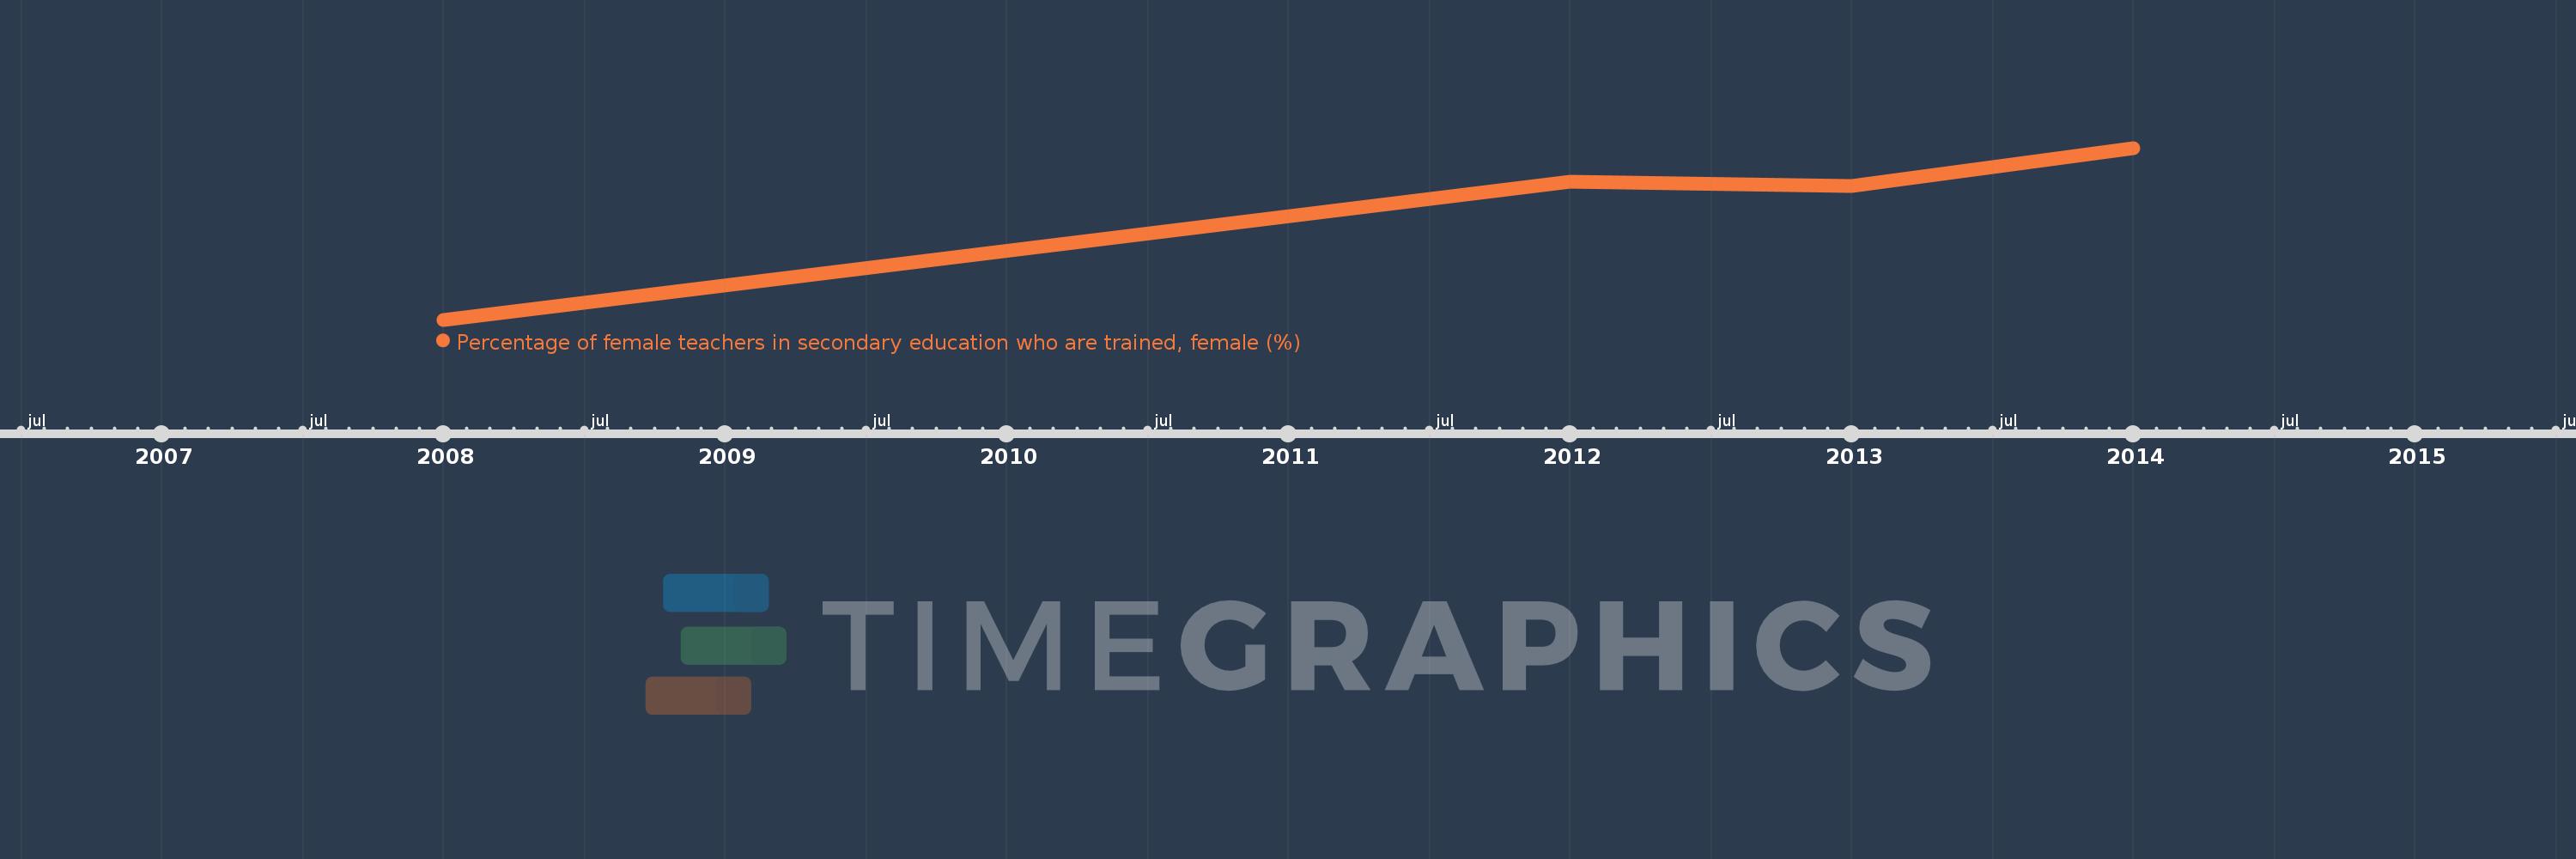
Percentage of female teachers in secondary education who are trained, female (%)
2014,2013,2012,2008
This statistics in other country:
Timeline:
This timeline shows a graph from 2008 to 2014 of Rwanda. No data until 2007. Number of actual observations by date: 4.
Source name:
World Development Indicators
Source organization:
UNESCO Institute for Statistics
Categories, topics:
Education
Last updated:
apr 23, 2017
Indicators value changes by year
Minimum:
36.508
jan 1, 2008
Maximum:
80.569
jan 1, 2014
At the date of observation
Value
Absolute change
Change from previous value
jan 1, 2008
36.508
+36.508
0.0%
jan 1, 2012
71.967
+35.459
97.13%
jan 1, 2013
70.777
-1.19
-1.65%
jan 1, 2014
80.569
+9.792
13.83%
Ranking of countries by current statistics by years


Comments: