29
/
en
AIzaSyAYiBZKx7MnpbEhh9jyipgxe19OcubqV5w
April 1, 2024
199611
Mongolia
MNG
true
2
1
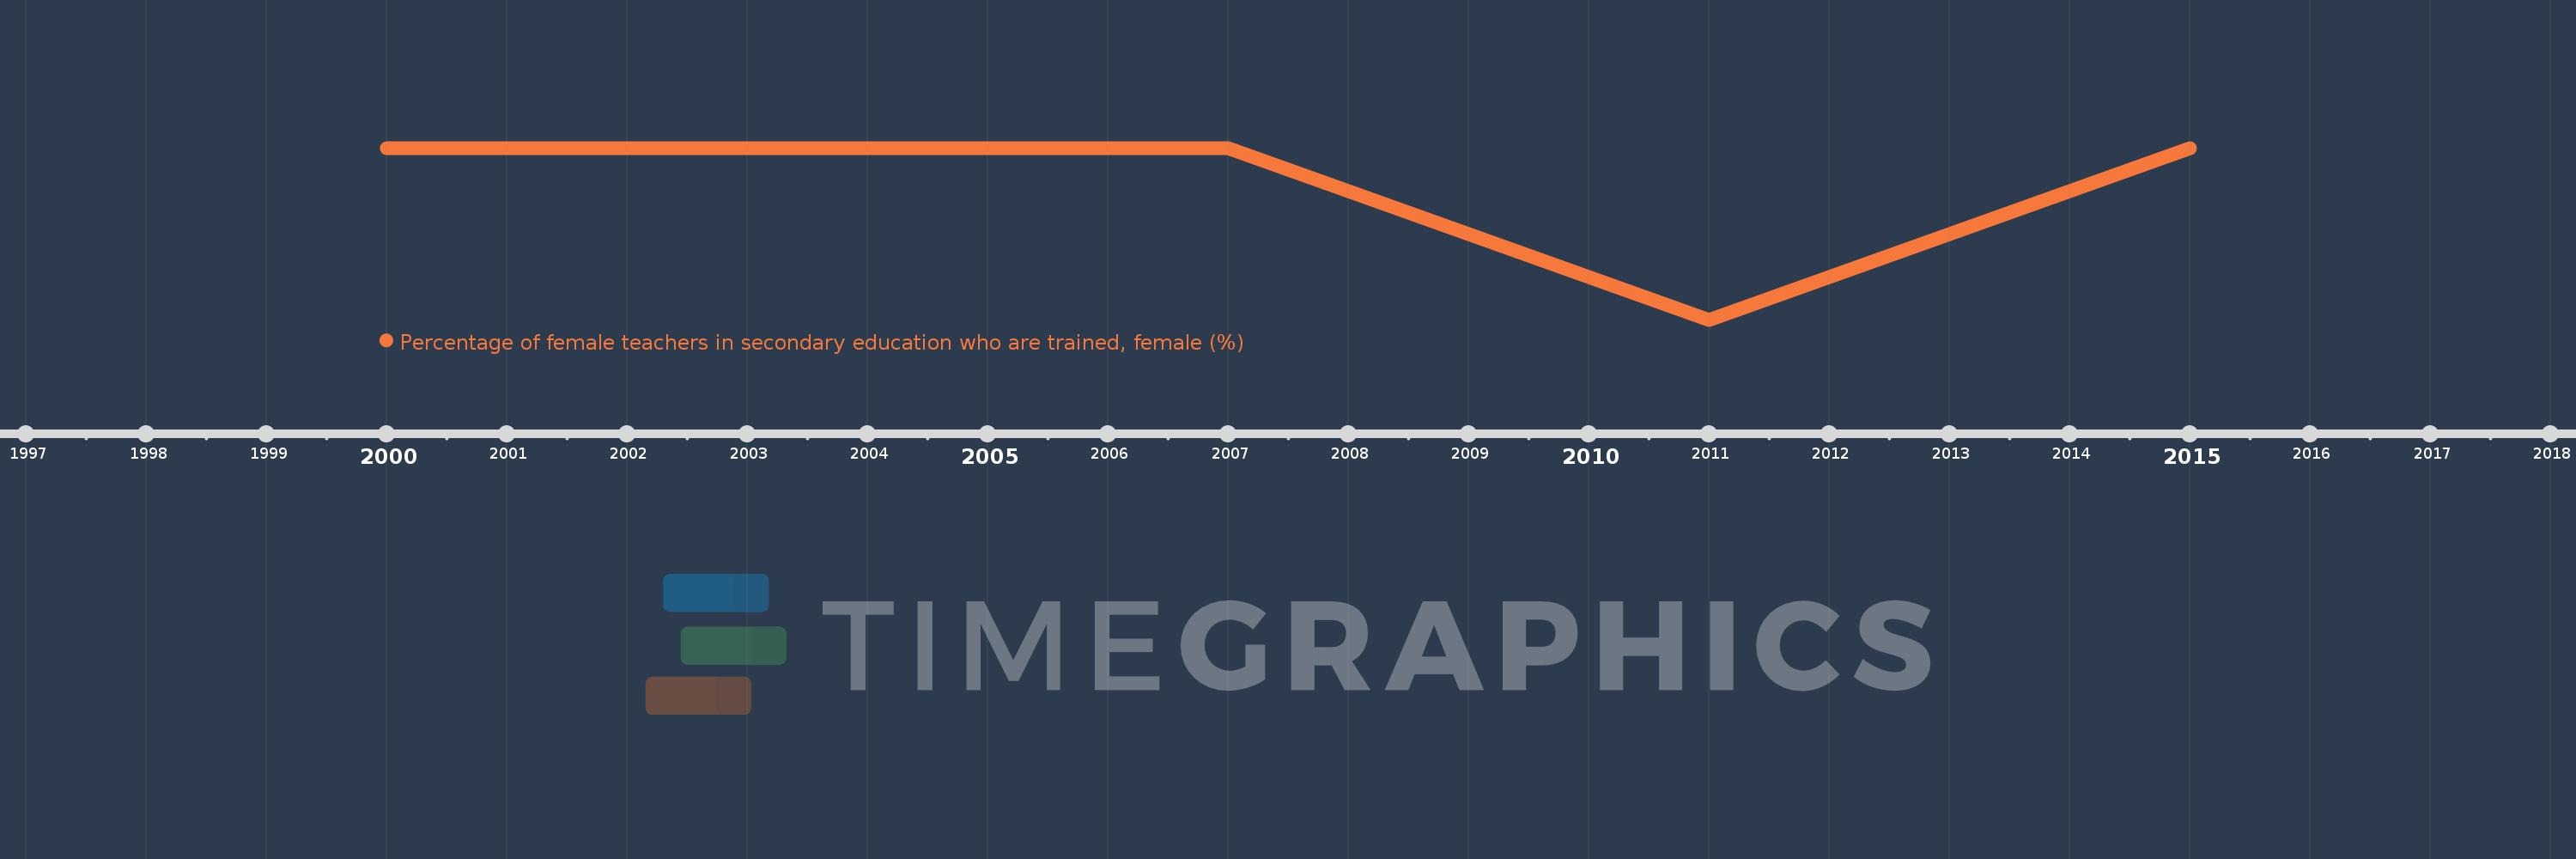
Percentage of female teachers in secondary education who are trained, female (%)
2015,2011,2007,2006,2005,2004,2003,2002,2001,2000
This statistics in other country:
Timeline:
This timeline shows a graph from 2000 to 2015 of Mongolia. No data until 1999. Number of actual observations by date: 10.
Source name:
World Development Indicators
Source organization:
UNESCO Institute for Statistics
Categories, topics:
Education
Last updated:
apr 23, 2017
Indicators value changes by year
Minimum:
98.369
jan 1, 2011
At the date of observation
Value
Absolute change
Change from previous value
jan 1, 2000
100.0
+100.0
0.0%
jan 1, 2001
100.0
0.0
0.0%
jan 1, 2002
100.0
0.0
0.0%
jan 1, 2003
100.0
0.0
0.0%
jan 1, 2004
100.0
0.0
0.0%
jan 1, 2005
100.0
0.0
0.0%
jan 1, 2006
100.0
0.0
0.0%
jan 1, 2007
100.0
0.0
0.0%
jan 1, 2011
98.369
-1.631
-1.63%
jan 1, 2015
100.0
+1.631
1.66%
Ranking of countries by current statistics by years


Comments: