29
/
en
AIzaSyAYiBZKx7MnpbEhh9jyipgxe19OcubqV5w
April 1, 2024
123954
Ecuador
ECU
true
2
1
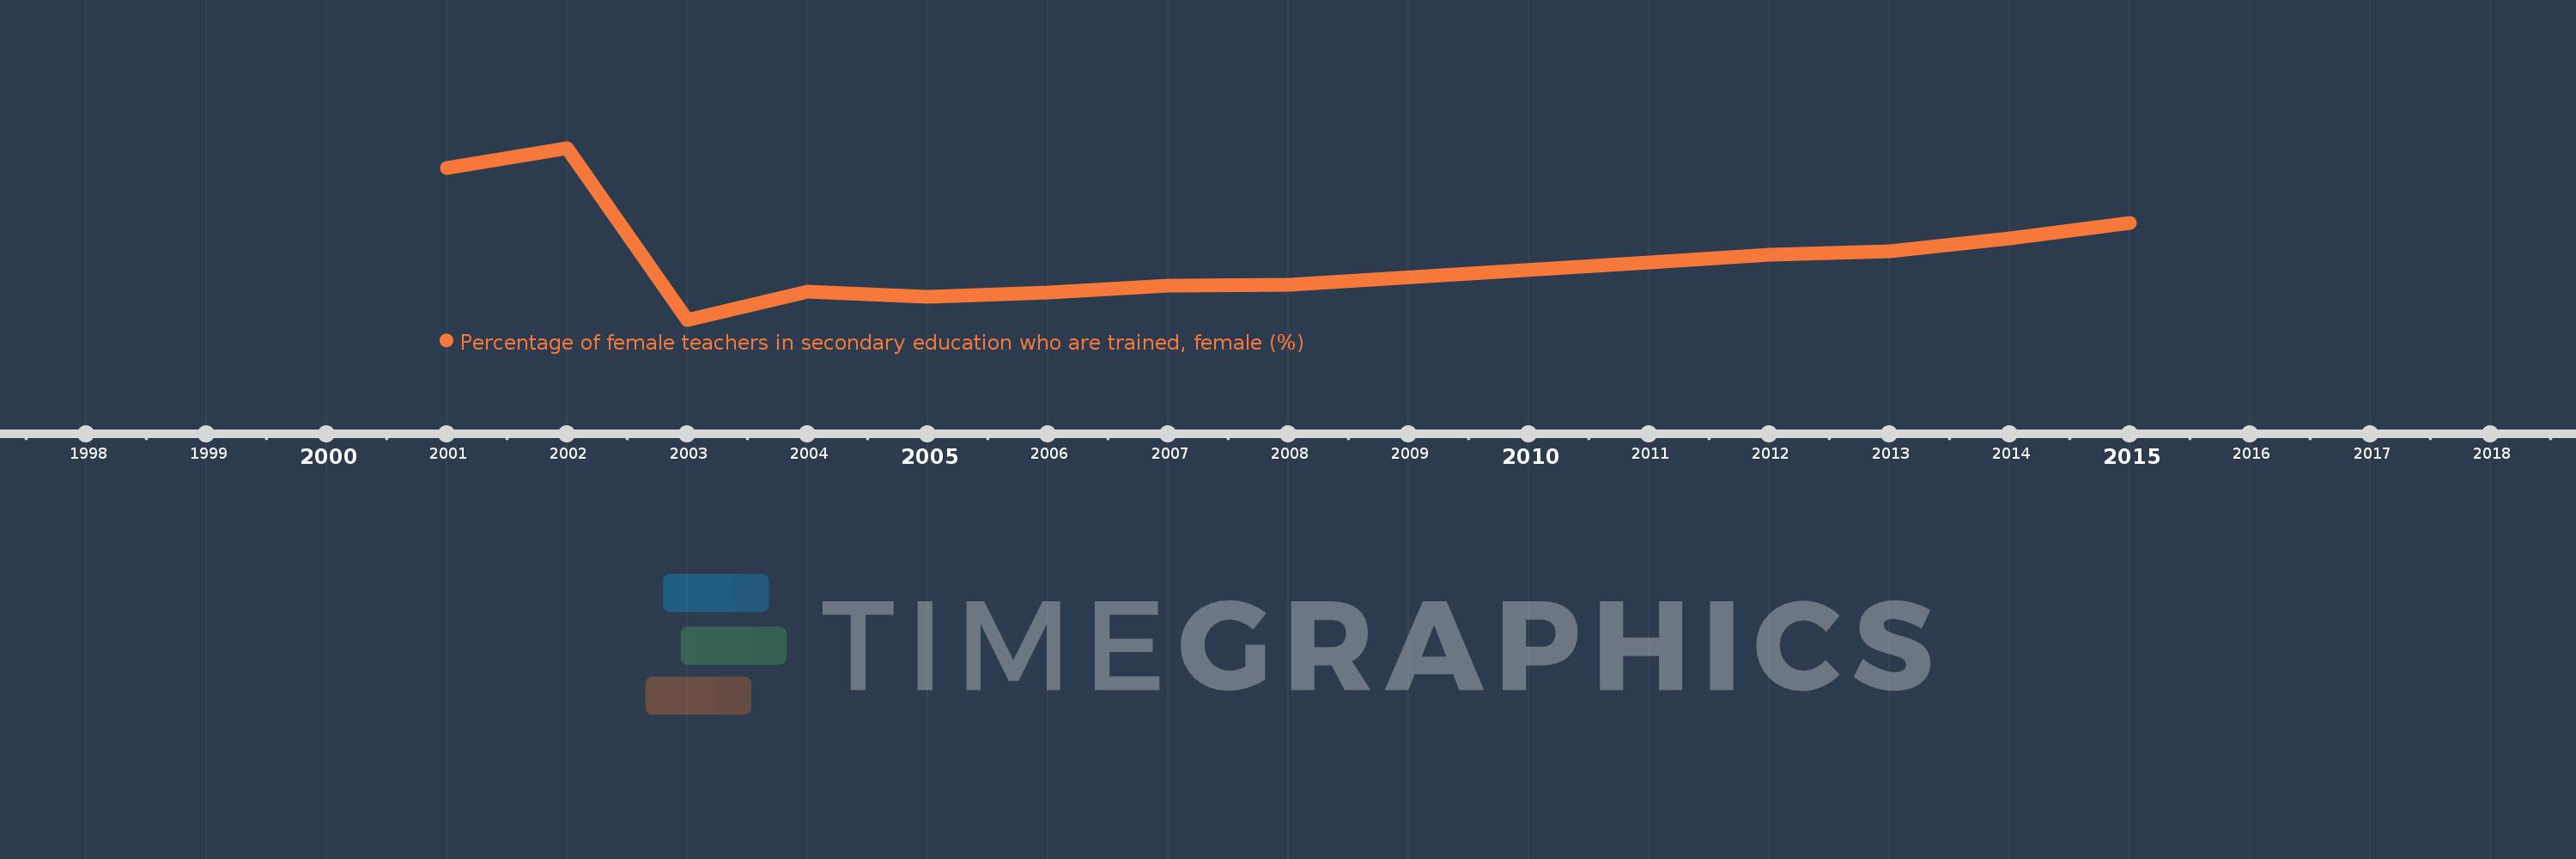
Percentage of female teachers in secondary education who are trained, female (%)
2015,2014,2013,2012,2011,2008,2007,2006,2005,2004,2003,2002,2001
This statistics in other country:
Timeline:
This timeline shows a graph from 2001 to 2015 of Ecuador. No data until 2000. Number of actual observations by date: 13.
Source name:
World Development Indicators
Source organization:
UNESCO Institute for Statistics
Categories, topics:
Education
Last updated:
apr 23, 2017
Indicators value changes by year
Minimum:
74.023
jan 1, 2003
Maximum:
87.338
jan 1, 2002
At the date of observation
Value
Absolute change
Change from previous value
jan 1, 2001
85.779
+85.779
0.0%
jan 1, 2002
87.338
+1.559
1.82%
jan 1, 2003
74.023
-13.315
-15.25%
jan 1, 2004
76.223
+2.2
2.97%
jan 1, 2005
75.771
-0.452
-0.59%
jan 1, 2006
76.148
+0.377
0.5%
jan 1, 2007
76.635
+0.488
0.64%
jan 1, 2008
76.728
+0.093
0.12%
jan 1, 2011
78.431
+1.703
2.22%
jan 1, 2012
79.047
+0.616
0.79%
jan 1, 2013
79.354
+0.307
0.39%
jan 1, 2014
80.313
+0.959
1.21%
jan 1, 2015
81.545
+1.232
1.53%
Ranking of countries by current statistics by years


Comments: