29
/
en
AIzaSyAYiBZKx7MnpbEhh9jyipgxe19OcubqV5w
April 1, 2024
55781
Pre-demographic dividend
PRE
false
2
1
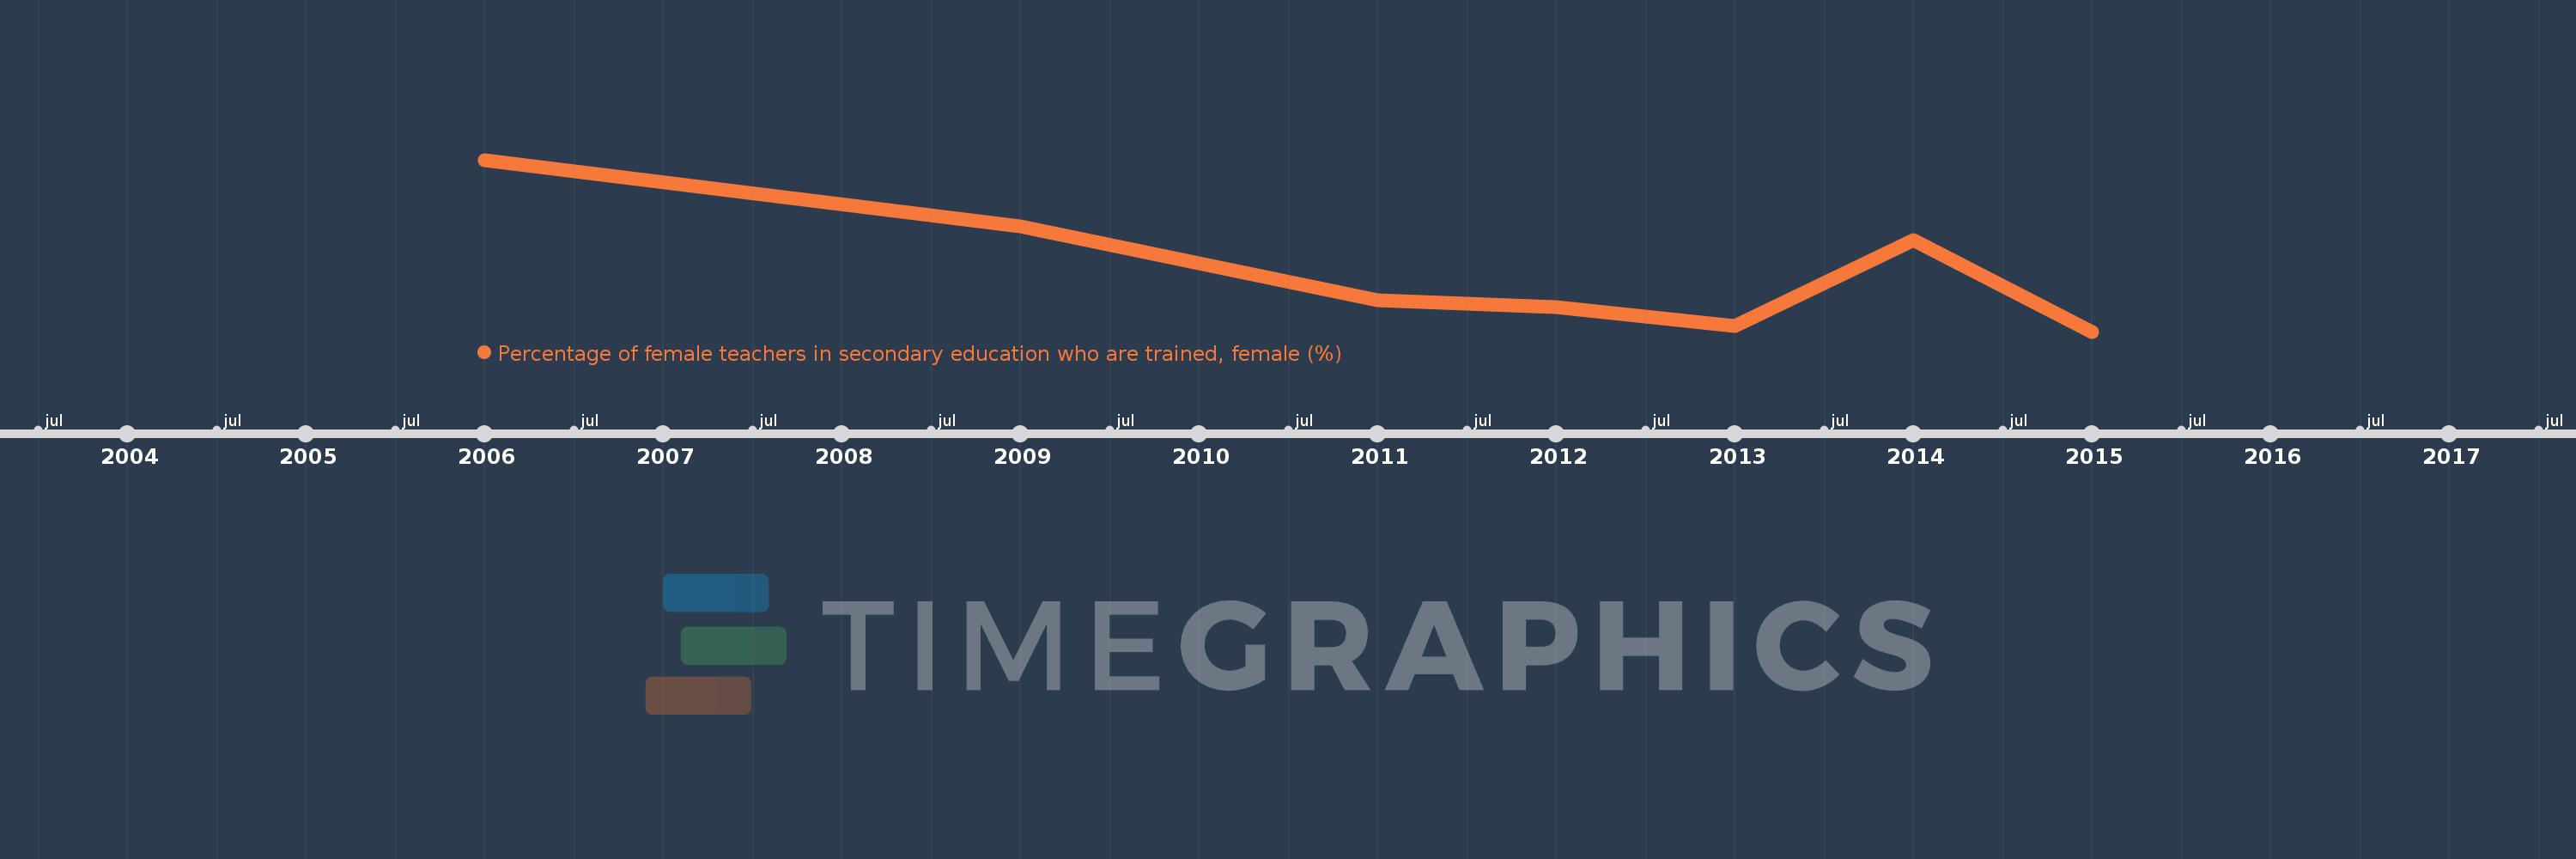
Percentage of female teachers in secondary education who are trained, female (%)
2015,2014,2013,2012,2011,2010,2009,2006
This statistics in other country:
Timeline:
This timeline shows a graph from 2006 to 2015 of Pre-demographic dividend. No data until 2005. Number of actual observations by date: 8.
Source name:
World Development Indicators
Source organization:
UNESCO Institute for Statistics
Categories, topics:
Education
Last updated:
apr 23, 2017
Indicators value changes by year
Minimum:
58.159
jan 1, 2015
Maximum:
83.345
jan 1, 2006
At the date of observation
Value
Absolute change
Change from previous value
jan 1, 2006
83.345
+83.345
0.0%
jan 1, 2009
73.603
-9.742
-11.69%
jan 1, 2010
68.145
-5.458
-7.42%
jan 1, 2011
62.725
-5.42
-7.95%
jan 1, 2012
61.797
-0.928
-1.48%
jan 1, 2013
58.974
-2.823
-4.57%
jan 1, 2014
71.564
+12.59
21.35%
jan 1, 2015
58.159
-13.405
-18.73%
Ranking of countries by current statistics by years


Comments: