Download This statistics in other country:
Timeline:
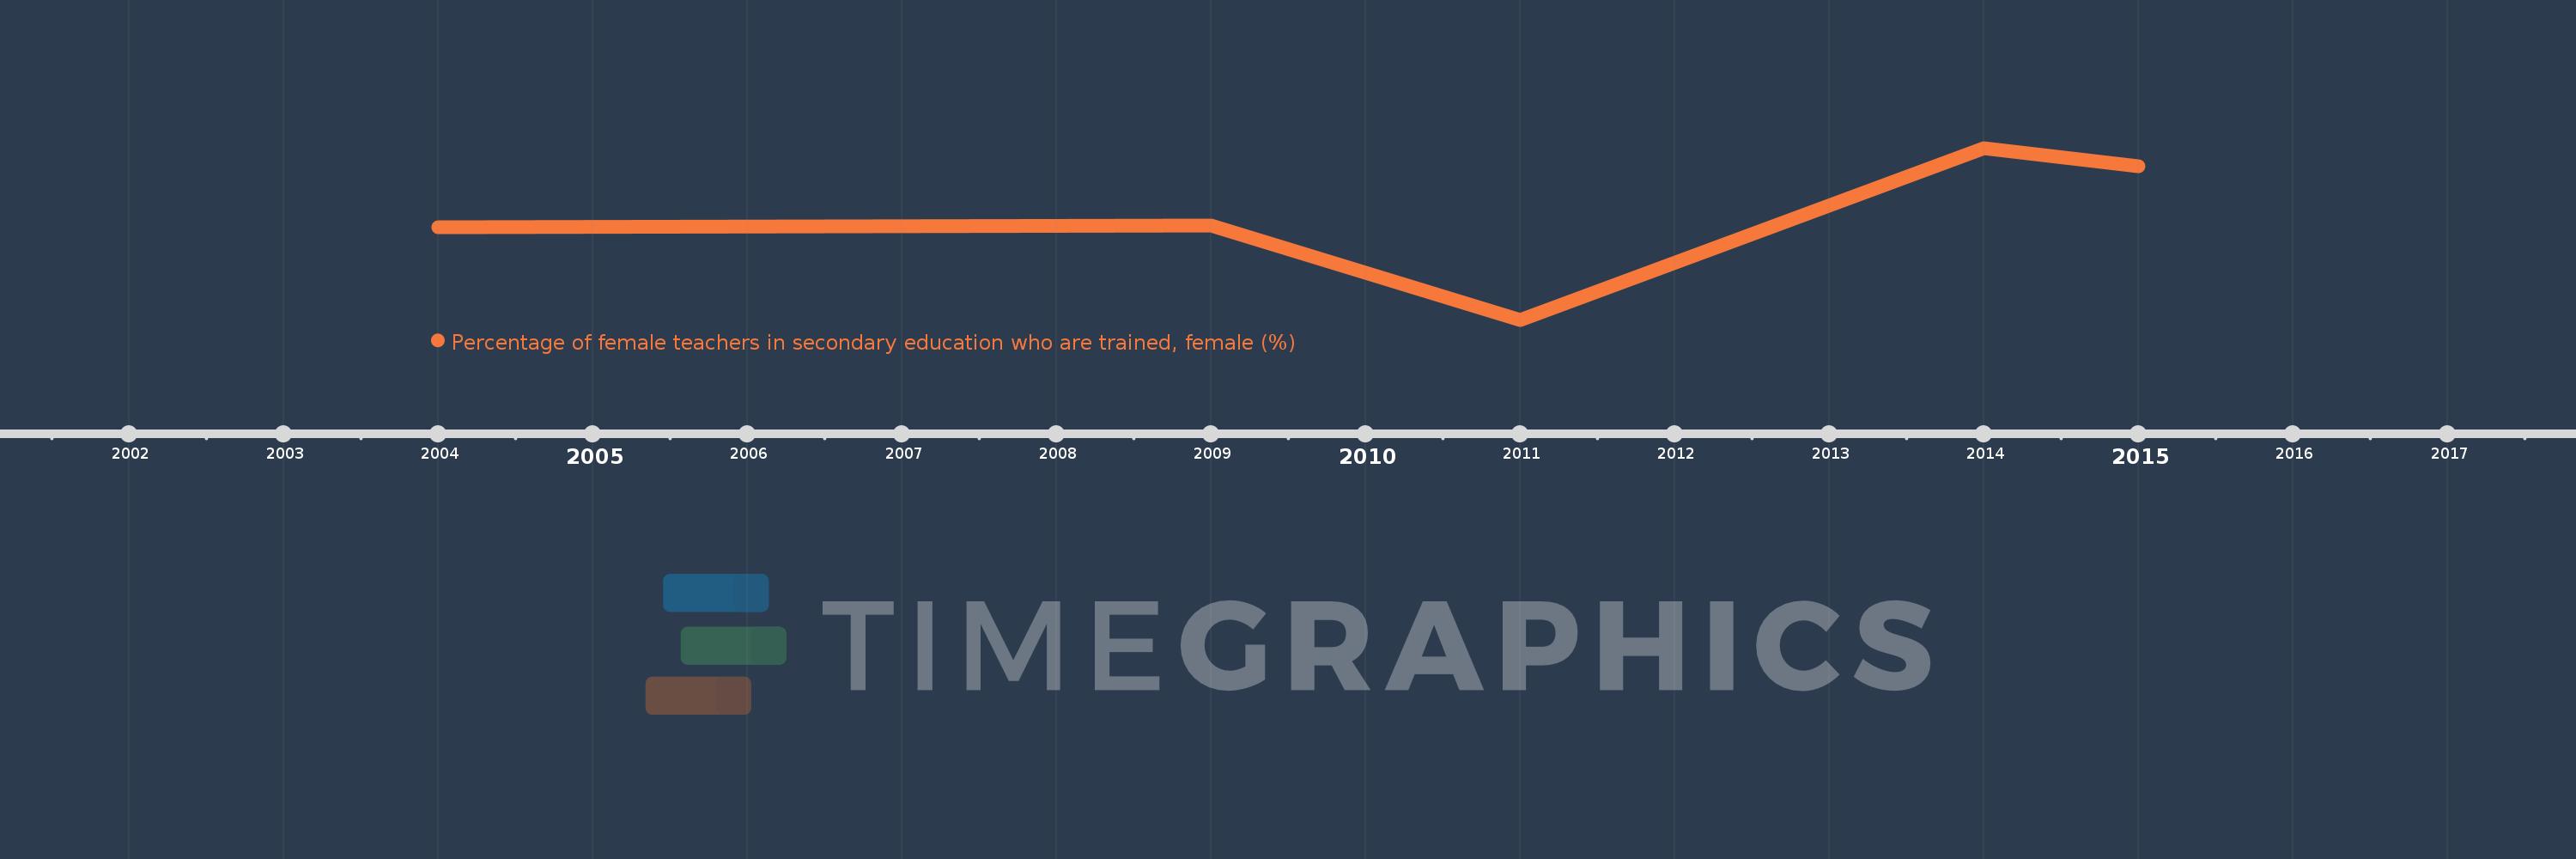
This timeline shows a graph from 2004 to 2015 of Grenada. No data until 2003. Number of actual observations by date: 5.
Source name:
World Development Indicators
Source organization:
UNESCO Institute for Statistics
Categories, topics:
Education
Last updated:
apr 23, 2017
Indicators value changes by year
Minimum:
11.207
jan 1, 2011
Maximum:
43.488
jan 1, 2014
At the date of observation
Value
Absolute change
Change from the previous value
jan 1, 2004
28.541
+28.541
0.0%
jan 1, 2009
28.947
+0.407
1.42%
jan 1, 2011
11.207
-17.74
-61.29%
jan 1, 2014
43.488
+32.281
288.05%
jan 1, 2015
40.0
-3.488
-8.02%
Ranking of countries by current statistics by years
