29
/
en
AIzaSyAYiBZKx7MnpbEhh9jyipgxe19OcubqV5w
April 1, 2024
229577
Russian Federation
RUS
true
2
1
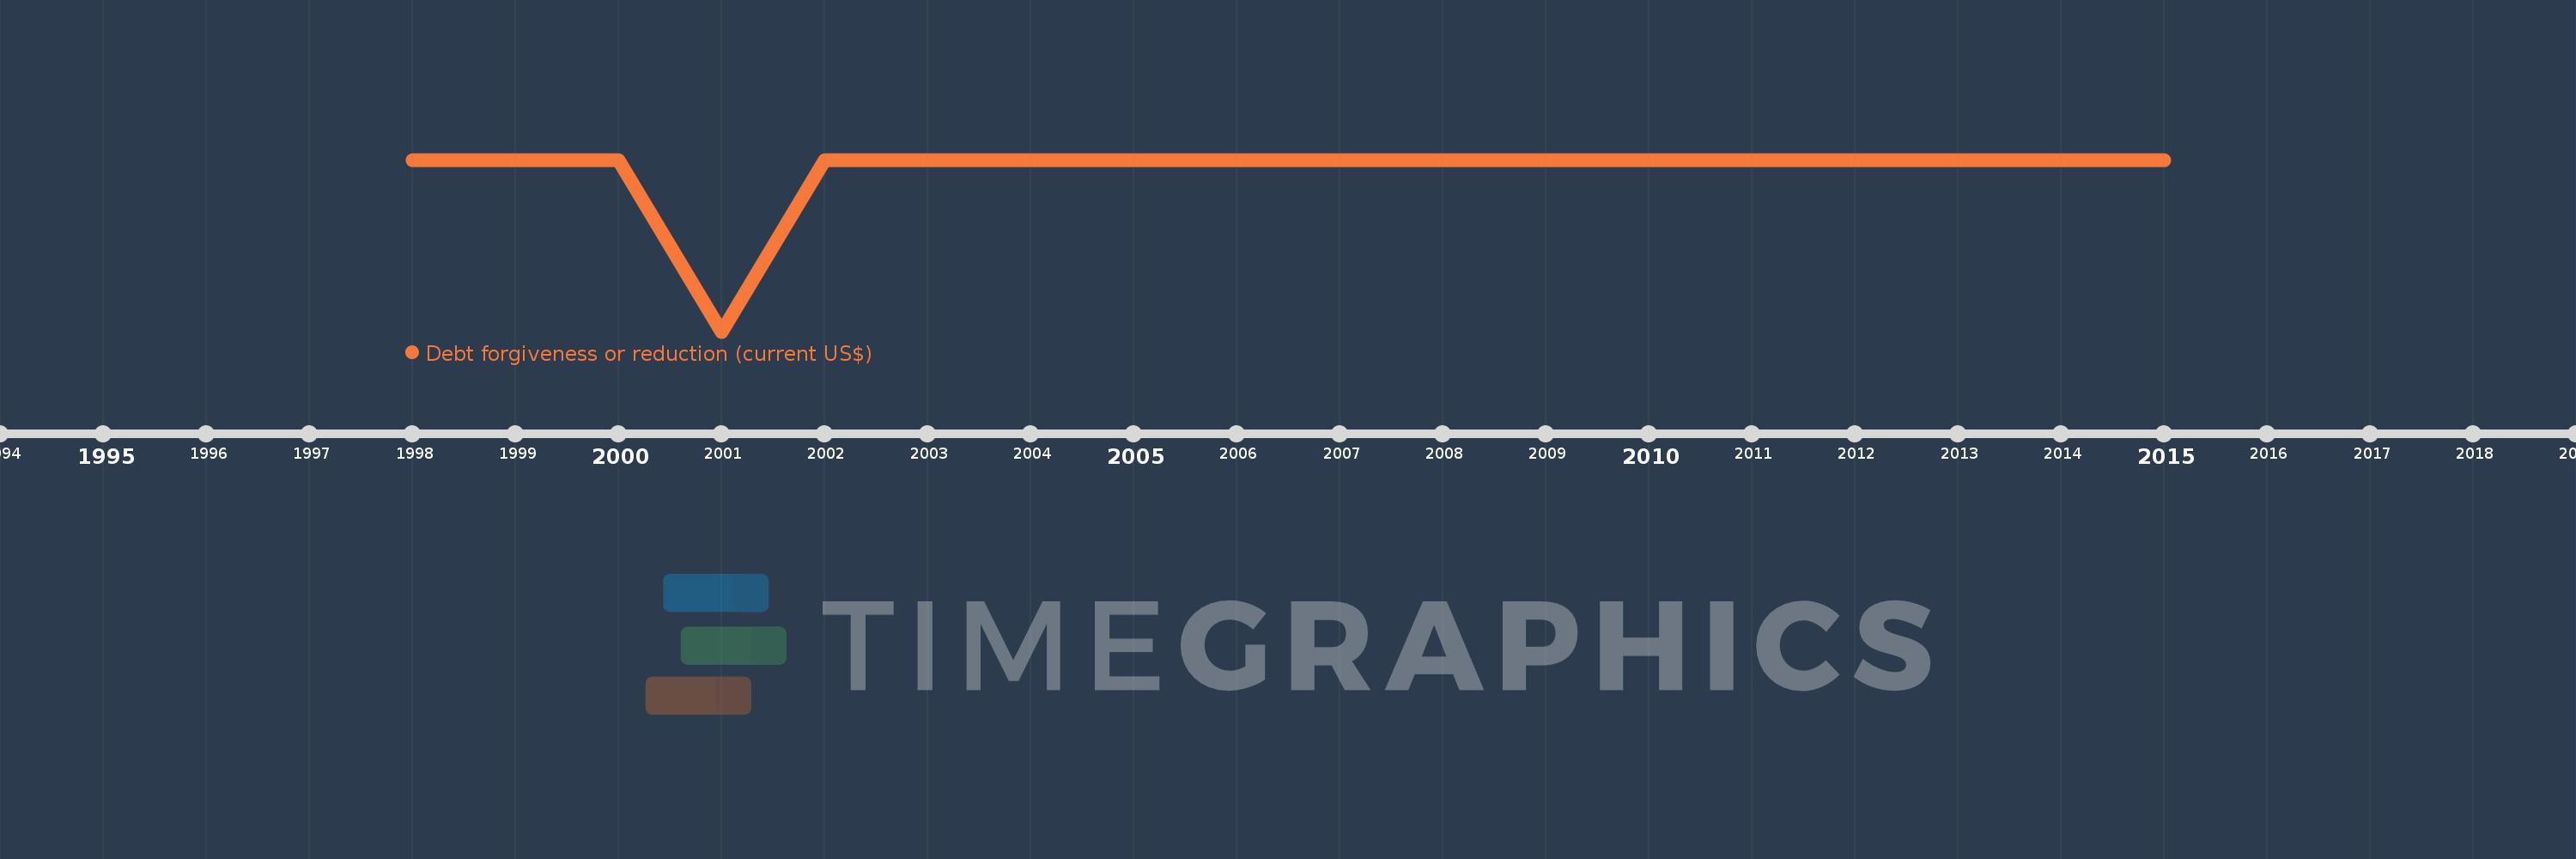
Debt forgiveness or reduction (current US$)
2015,2013,2010,2008,2002,2001,2000,1998
This statistics in other country:
Timeline:
This timeline shows a graph from 1998 to 2015 of Russian Federation. No data until 1997. Number of actual observations by date: 8.
Source name:
World Development Indicators
Source organization:
World Bank, International Debt Statistics.
Categories, topics:
External Debt
Last updated:
apr 23, 2017
Indicators value changes by year
Minimum:
-11.6 bln
jan 1, 2001
At the date of observation
Value
Absolute change
Change from previous value
jan 1, 1998
-4.58 mln
-4.58 mln
0.0%
jan 1, 2000
0.0
+4.58 mln
-100.0%
jan 1, 2001
-11.6 bln
-11.6 bln
%
jan 1, 2002
0.0
+11.6 bln
-100.0%
Ranking of countries by current statistics by years


Comments: