29
/
en
AIzaSyAYiBZKx7MnpbEhh9jyipgxe19OcubqV5w
April 1, 2024
135368
Gabon
GAB
true
2
1
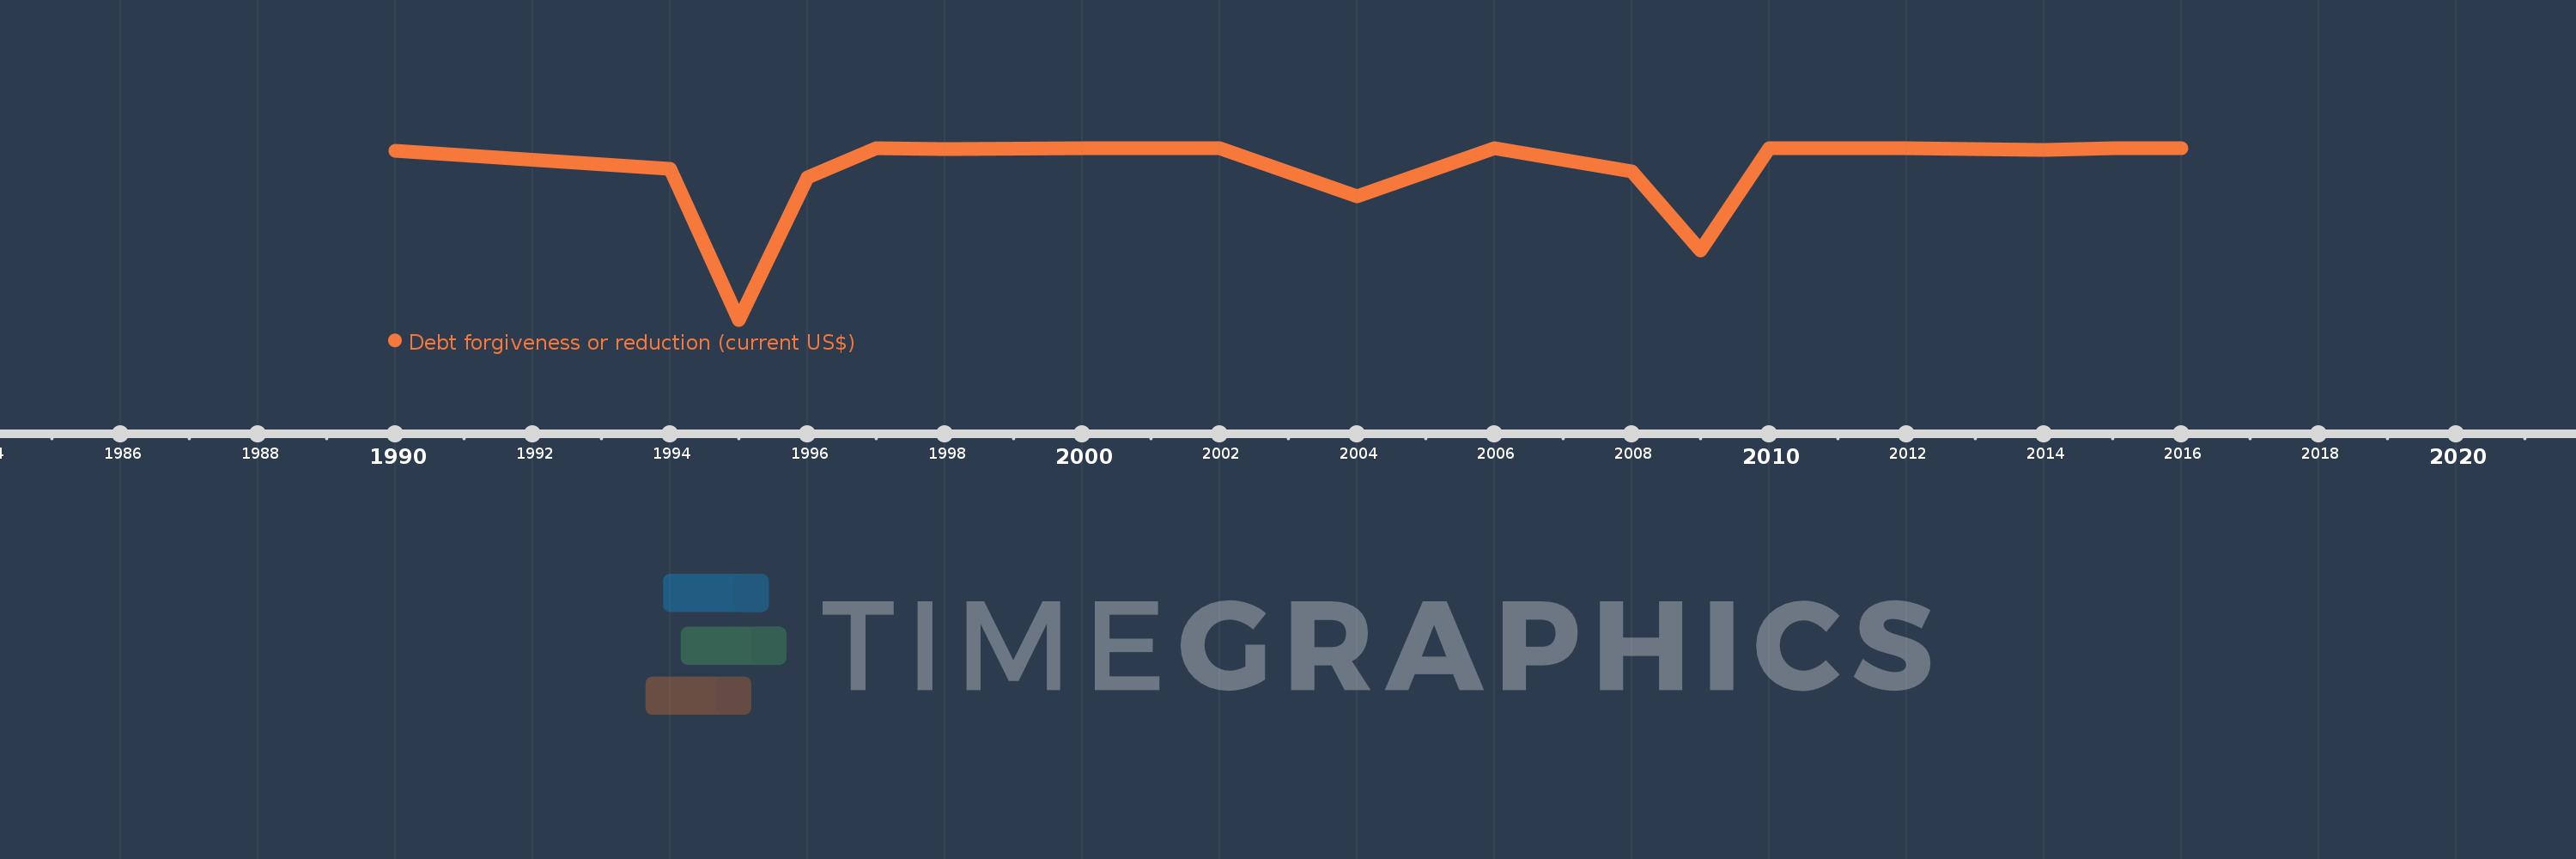
Debt forgiveness or reduction (current US$)
2016,2015,2014,2013,2012,2011,2010,2009,2008,2006,2004,2002,2000,1998,1997,1996,1995,1994,1990
This statistics in other country:
Timeline:
This timeline shows a graph from 1990 to 2016 of Gabon. No data until 1989. Number of actual observations by date: 19.
Source name:
World Development Indicators
Source organization:
World Bank, International Debt Statistics.
Categories, topics:
External Debt
Last updated:
apr 23, 2017
Indicators value changes by year
Minimum:
-239.769 mln
jan 1, 1995
At the date of observation
Value
Absolute change
Change from previous value
jan 1, 1990
-4.276 mln
-4.276 mln
0.0%
jan 1, 1994
-29.168 mln
-24.892 mln
582.13%
jan 1, 1995
-239.769 mln
-210.601 mln
722.03%
jan 1, 1996
-41.187 mln
+198.582 mln
-82.82%
jan 1, 1997
0.0
+41.187 mln
-100.0%
jan 1, 1998
-2.091 mln
-2.091 mln
%
jan 1, 2000
0.0
+2.091 mln
-100.0%
jan 1, 2004
-67.239 mln
-67.239 mln
%
jan 1, 2006
0.0
+67.239 mln
-100.0%
jan 1, 2008
-32.647 mln
-32.647 mln
%
jan 1, 2009
-143.553 mln
-110.906 mln
339.71%
jan 1, 2010
0.0
+143.553 mln
-100.0%
jan 1, 2013
-1.178 mln
-1.178 mln
%
jan 1, 2014
-2.848 mln
-1.67 mln
141.77%
jan 1, 2015
0.0
+2.848 mln
-100.0%
jan 1, 2016
-352.0K
-352.0K
%
Ranking of countries by current statistics by years


Comments: