29
/
en
AIzaSyAYiBZKx7MnpbEhh9jyipgxe19OcubqV5w
April 1, 2024
90965
Brazil
BRA
true
2
1
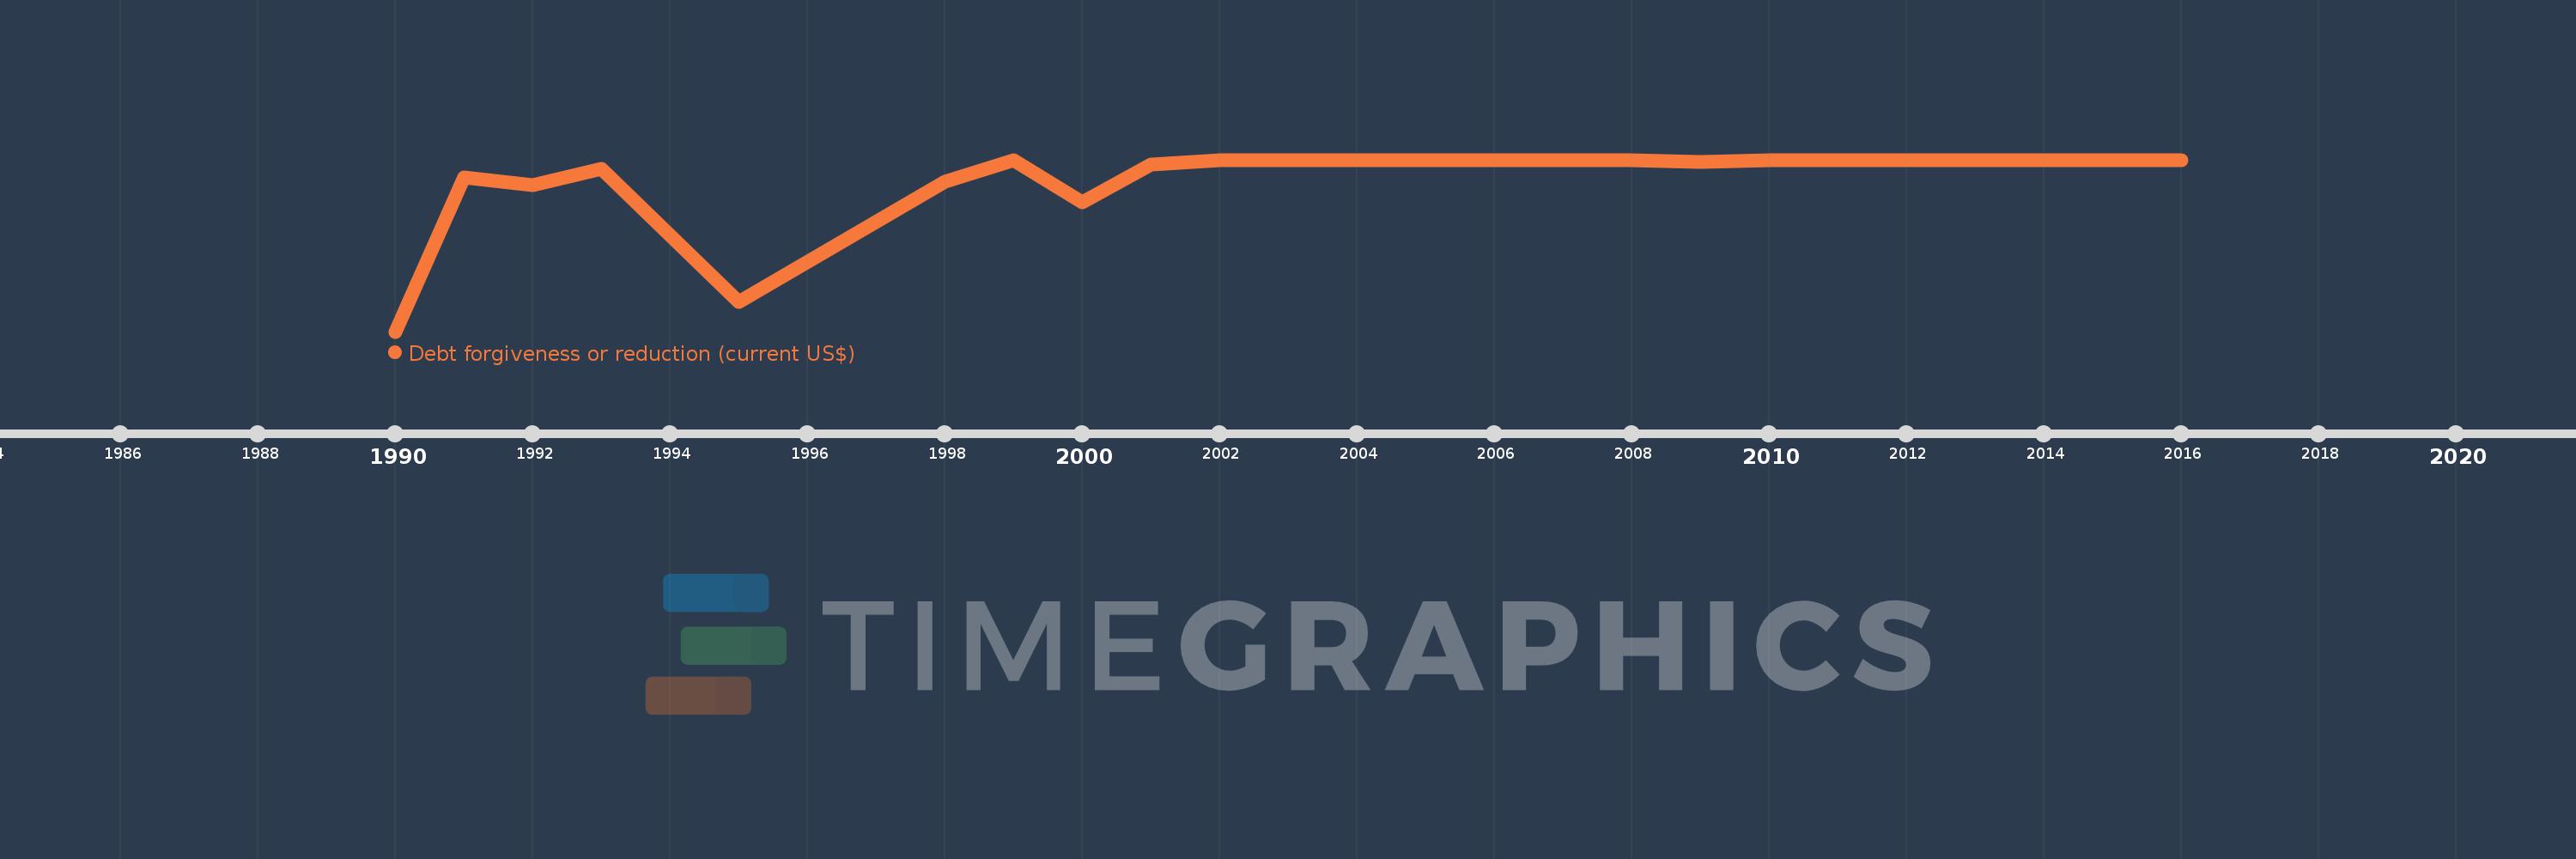
Debt forgiveness or reduction (current US$)
2016,2015,2014,2013,2012,2011,2010,2009,2008,2007,2006,2005,2004,2002,2001,2000,1999,1998,1995,1993,1992,1991,1990
This statistics in other country:
Timeline:
This timeline shows a graph from 1990 to 2016 of Brazil. No data until 1989. Number of actual observations by date: 23.
Source name:
World Development Indicators
Source organization:
World Bank, International Debt Statistics.
Categories, topics:
External Debt
Last updated:
apr 23, 2017
Indicators value changes by year
Minimum:
-4.724 bln
jan 1, 1990
At the date of observation
Value
Absolute change
Change from previous value
jan 1, 1990
-4.724 bln
-4.724 bln
0.0%
jan 1, 1991
-483.0 mln
+4.241 bln
-89.78%
jan 1, 1992
-690.0 mln
-207.0 mln
42.86%
jan 1, 1993
-257.0 mln
+433.0 mln
-62.75%
jan 1, 1995
-3.9 bln
-3.643 bln
1.42K%
jan 1, 1998
-600.0 mln
+3.3 bln
-84.62%
jan 1, 1999
0.0
+600.0 mln
-100.0%
jan 1, 2000
-1.181 bln
-1.181 bln
%
jan 1, 2001
-137.16 mln
+1.043 bln
-88.38%
jan 1, 2002
-7.0K
+137.153 mln
-99.99%
jan 1, 2004
0.0
+7.0K
-100.0%
jan 1, 2009
-56.202 mln
-56.202 mln
%
jan 1, 2010
0.0
+56.202 mln
-100.0%
jan 1, 2014
-182.0K
-173.0K
1.92K%
jan 1, 2015
-85.0K
+97.0K
-53.3%
jan 1, 2016
-137.0K
-52.0K
61.18%
Ranking of countries by current statistics by years


Comments: