29
/
en
AIzaSyAYiBZKx7MnpbEhh9jyipgxe19OcubqV5w
April 1, 2024
267813
Tunisia
TUN
true
2
1
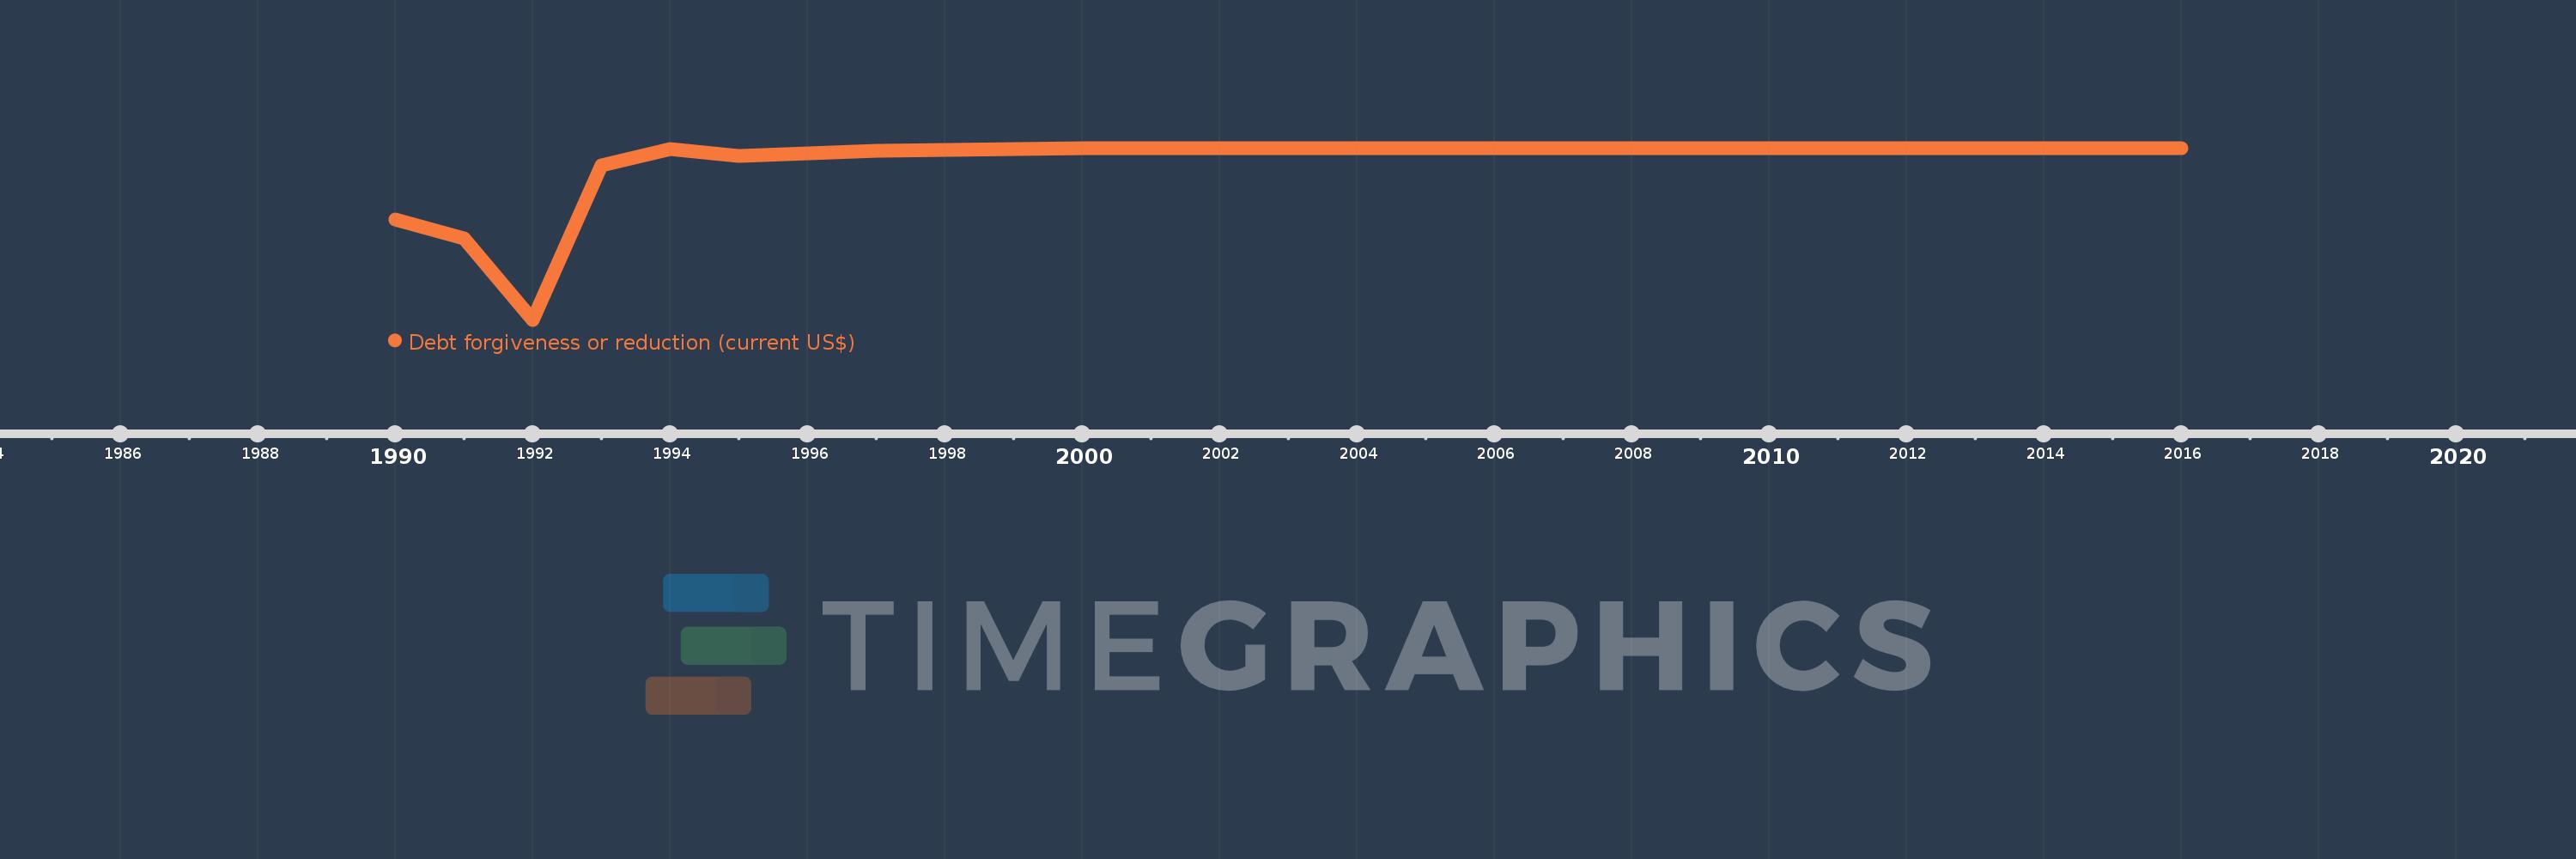
Debt forgiveness or reduction (current US$)
2016,2015,2014,2013,2011,2010,2009,2008,2006,2003,2002,2001,2000,1997,1995,1994,1993,1992,1991,1990
This statistics in other country:
Timeline:
This timeline shows a graph from 1990 to 2016 of Tunisia. No data until 1989. Number of actual observations by date: 20.
Source name:
World Development Indicators
Source organization:
World Bank, International Debt Statistics.
Categories, topics:
External Debt
Last updated:
apr 23, 2017
Indicators value changes by year
Minimum:
-13.332 mln
jan 1, 1992
At the date of observation
Value
Absolute change
Change from previous value
jan 1, 1990
-5.565 mln
-5.565 mln
0.0%
jan 1, 1991
-7.0 mln
-1.435 mln
25.79%
jan 1, 1992
-13.332 mln
-6.332 mln
90.46%
jan 1, 1993
-1.38 mln
+11.952 mln
-89.65%
jan 1, 1994
-89.0K
+1.291 mln
-93.55%
jan 1, 1995
-640.0K
-551.0K
619.1%
jan 1, 1997
-191.0K
+449.0K
-70.16%
jan 1, 2000
0.0
+191.0K
-100.0%
Ranking of countries by current statistics by years


Comments: