29
/
en
AIzaSyAYiBZKx7MnpbEhh9jyipgxe19OcubqV5w
April 1, 2024
123313
Ecuador
ECU
true
2
1
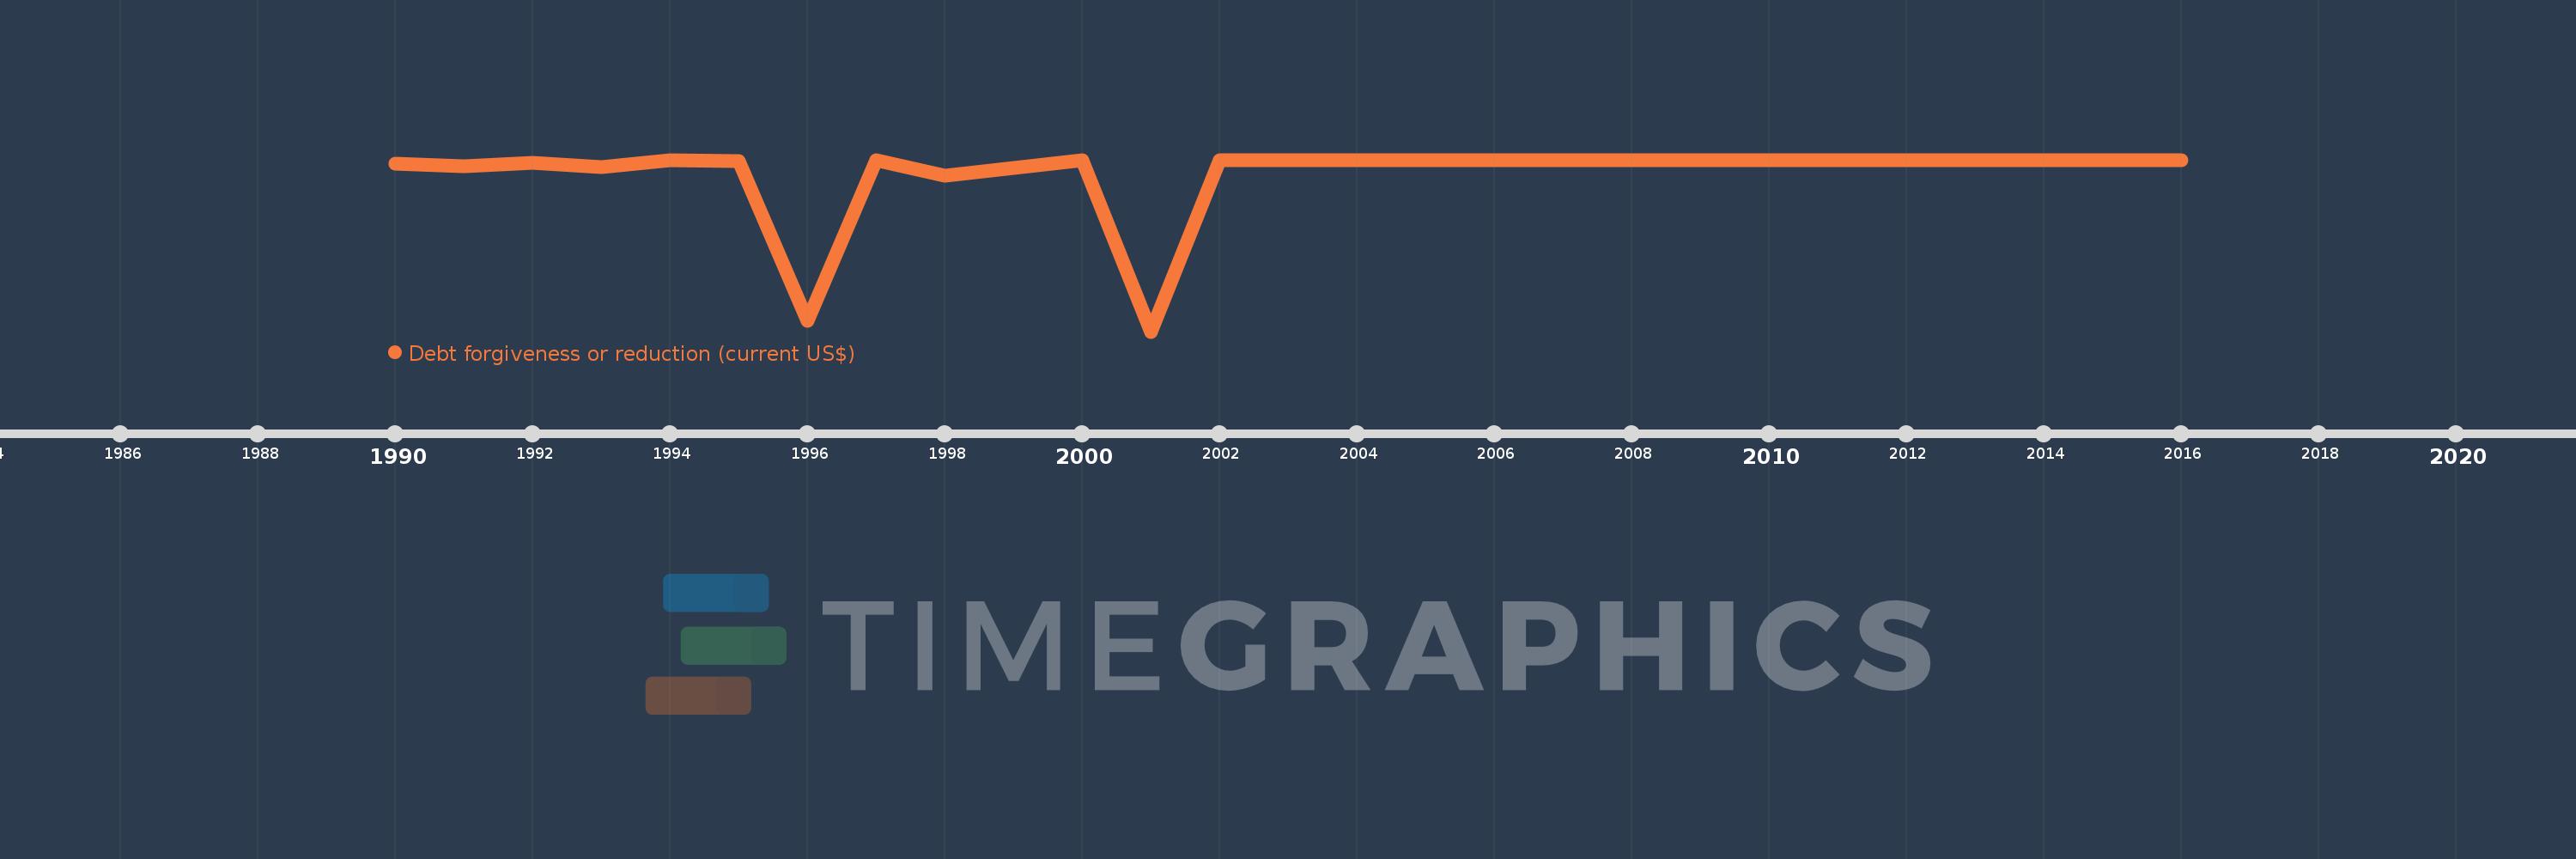
Debt forgiveness or reduction (current US$)
2016,2015,2014,2013,2012,2011,2010,2009,2008,2007,2006,2005,2004,2003,2002,2001,2000,1998,1997,1996,1995,1994,1993,1992,1991,1990
This statistics in other country:
Timeline:
This timeline shows a graph from 1990 to 2016 of Ecuador. No data until 1989. Number of actual observations by date: 26.
Source name:
World Development Indicators
Source organization:
World Bank, International Debt Statistics.
Categories, topics:
External Debt
Last updated:
apr 23, 2017
Indicators value changes by year
Minimum:
-1.259 bln
jan 1, 2001
At the date of observation
Value
Absolute change
Change from previous value
jan 1, 1990
-31.214 mln
-31.214 mln
0.0%
jan 1, 1991
-46.097 mln
-14.883 mln
47.68%
jan 1, 1992
-19.775 mln
+26.322 mln
-57.1%
jan 1, 1993
-52.197 mln
-32.422 mln
163.95%
jan 1, 1994
-26.0K
+52.171 mln
-99.95%
jan 1, 1995
-9.88 mln
-9.854 mln
37.9K%
jan 1, 1996
-1.183 bln
-1.173 bln
11.87K%
jan 1, 1997
-2.281 mln
+1.181 bln
-99.81%
jan 1, 1998
-115.25 mln
-112.969 mln
4.95K%
jan 1, 2000
0.0
+115.25 mln
-100.0%
jan 1, 2001
-1.259 bln
-1.259 bln
%
jan 1, 2002
0.0
+1.259 bln
-100.0%
jan 1, 2004
-5.741 mln
-5.741 mln
%
jan 1, 2005
0.0
+5.741 mln
-100.0%
jan 1, 2006
-802.0K
-802.0K
%
jan 1, 2007
0.0
+802.0K
-100.0%
jan 1, 2008
-2.789 mln
-2.789 mln
%
jan 1, 2009
-1.079 mln
+1.71 mln
-61.31%
jan 1, 2010
0.0
+1.079 mln
-100.0%
jan 1, 2013
0.0
+6.0K
-100.0%
Ranking of countries by current statistics by years


Comments: