29
/
en
AIzaSyAYiBZKx7MnpbEhh9jyipgxe19OcubqV5w
April 1, 2024
213326
Nigeria
NGA
true
2
1
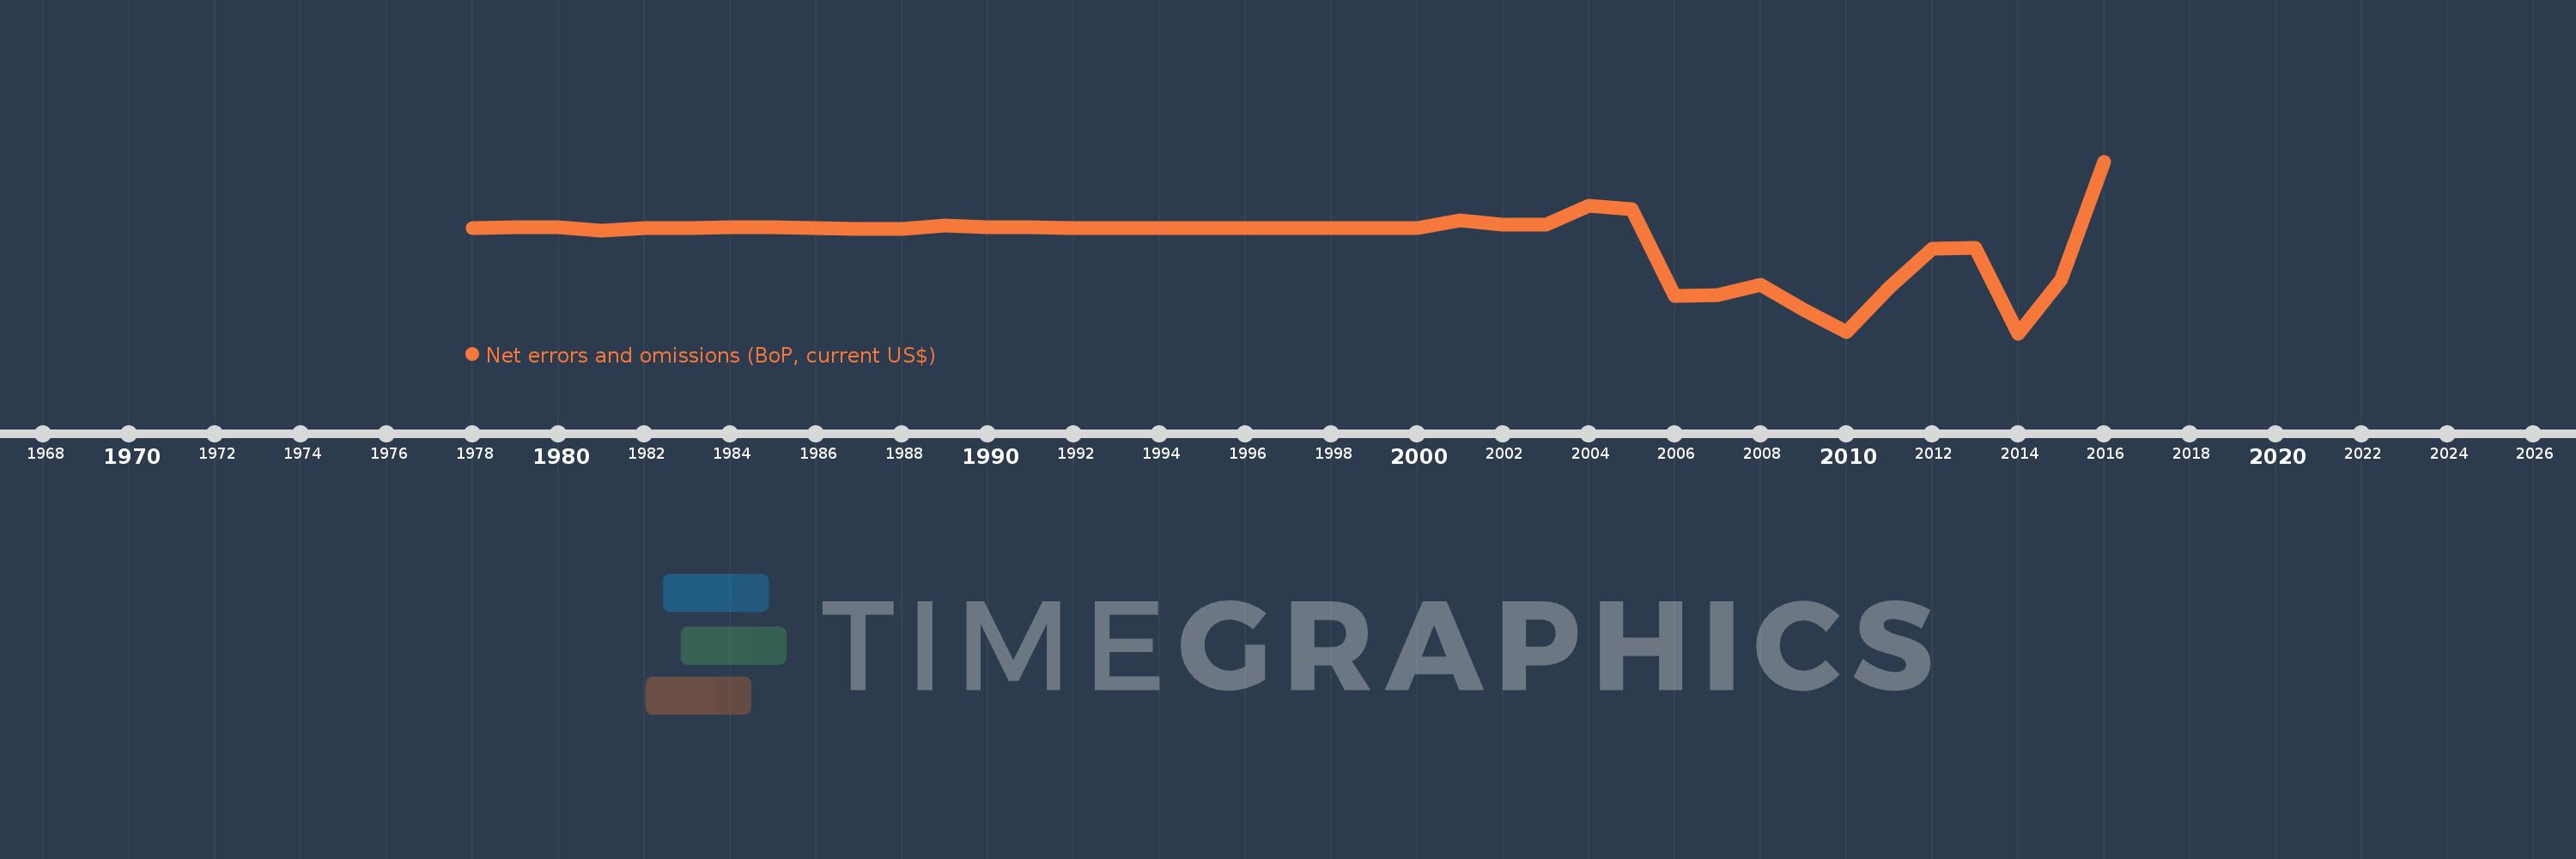
Net errors and omissions (BoP, current US$)
2016,2015,2014,2013,2012,2011,2010,2009,2008,2007,2006,2005,2004,2003,2002,2001,2000,1999,1998,1997,1996,1995,1994,1993,1992,1991,1990,1989,1988,1987,1986,1985,1984,1983,1982,1981,1980,1979,1978
This statistics in other country:
AfghanistanAlbaniaAlgeriaAngolaAntigua and BarbudaArgentinaArmeniaArubaAustraliaAustriaAzerbaijanBahamas, TheBahrainBangladeshBarbadosBelarusBelgiumBelizeBeninBermudaBhutanBoliviaBosnia and HerzegovinaBotswanaBrazilBrunei DarussalamBulgariaBurkina FasoBurundiCabo VerdeCambodiaCameroonCanadaCentral African RepublicChadChileChinaColombiaComorosCongo, Dem. Rep.Congo, Rep.Costa RicaCote d'IvoireCroatiaCuracaoCyprusCzech RepublicDenmarkDjiboutiDominicaDominican RepublicEcuadorEgypt, Arab Rep.El SalvadorEquatorial GuineaEritreaEstoniaEthiopiaEuro areaFijiFinlandFranceFrench PolynesiaGabonGambia, TheGeorgiaGermanyGhanaGreeceGrenadaGuatemalaGuineaGuinea-BissauGuyanaHaitiHondurasHong Kong SAR, ChinaHungaryIcelandIndiaIndonesiaIran, Islamic Rep.IraqIrelandIsraelItalyJamaicaJapanJordanKazakhstanKenyaKiribatiKorea, Rep.KosovoKuwaitKyrgyz RepublicLao PDRLatviaLebanonLesothoLiberiaLibyaLithuaniaLuxembourgMacao SAR, ChinaMacedonia, FYRMadagascarMalawiMalaysiaMaldivesMaliMaltaMarshall IslandsMauritaniaMauritiusMexicoMicronesia, Fed. Sts.MoldovaMongoliaMontenegroMoroccoMozambiqueMyanmarNamibiaNepalNetherlandsNew CaledoniaNew ZealandNicaraguaNigerNigeriaNorwayOmanPakistanPalauPanamaPapua New GuineaParaguayPeruPhilippinesPolandPortugalQatarRomaniaRussian FederationRwandaSamoaSao Tome and PrincipeSaudi ArabiaSenegalSerbiaSeychellesSierra LeoneSingaporeSint Maarten (Dutch part)Slovak RepublicSloveniaSolomon IslandsSouth AfricaSouth SudanSpainSri LankaSt. Kitts and NevisSt. LuciaSt. Vincent and the GrenadinesSudanSurinameSwazilandSwedenSwitzerlandSyrian Arab RepublicTajikistanTanzaniaThailandTimor-LesteTogoTongaTrinidad and TobagoTunisiaTurkeyTuvaluUgandaUkraineUnited KingdomUnited StatesUruguayVanuatuVenezuela, RBVietnamWest Bank and GazaYemen, Rep.ZambiaZimbabwe Timeline:
This timeline shows a graph from 1978 to 2016 of Nigeria. No data until 1977. Number of actual observations by date: 39.
Source name:
World Development Indicators
Source organization:
International Monetary Fund, Balance of Payments Statistics Yearbook and data files.
Categories, topics:
Economy & Growth
Last updated:
apr 23, 2017
Indicators value changes by year
Minimum:
-26.735 bln
jan 1, 2014
Maximum:
16.813 bln
jan 1, 2016
At the date of observation
Value
Absolute change
Change from previous value
jan 1, 1978
-40.329 mln
-40.329 mln
0.0%
jan 1, 1979
240.842 mln
+281.17 mln
-697.2%
jan 1, 1980
180.461 mln
-60.38 mln
-25.07%
jan 1, 1981
-724.239 mln
-904.7 mln
-501.33%
jan 1, 1982
-42.091 mln
+682.148 mln
-94.19%
jan 1, 1983
13.364 mln
+55.455 mln
-131.75%
jan 1, 1984
139.424 mln
+126.06 mln
943.3%
jan 1, 1985
253.089 mln
+113.666 mln
81.53%
jan 1, 1986
-129.787 mln
-382.876 mln
-151.28%
jan 1, 1987
-180.676 mln
-50.889 mln
39.21%
jan 1, 1988
-305.774 mln
-125.098 mln
69.24%
jan 1, 1989
682.482 mln
+988.256 mln
-323.2%
jan 1, 1990
127.038 mln
-555.445 mln
-81.39%
jan 1, 1991
234.327 mln
+107.289 mln
84.45%
jan 1, 1992
-91.401 mln
-325.728 mln
-139.01%
jan 1, 1993
-121.898 mln
-30.496 mln
33.37%
jan 1, 1994
-87.861 mln
+34.037 mln
-27.92%
jan 1, 1995
-139.025 mln
-51.164 mln
58.23%
jan 1, 1996
-103.51 mln
+35.515 mln
-25.55%
jan 1, 1997
-60.298 mln
+43.212 mln
-41.75%
jan 1, 1998
-111.581 mln
-51.283 mln
85.05%
jan 1, 1999
-148.999 mln
-37.418 mln
33.53%
jan 1, 2000
-53.877 mln
+95.122 mln
-63.84%
jan 1, 2001
1.849 bln
+1.903 bln
-3.53K%
jan 1, 2002
779.11 mln
-1.07 bln
-57.86%
jan 1, 2003
837.423 mln
+58.314 mln
7.48%
jan 1, 2004
5.634 bln
+4.796 bln
572.74%
jan 1, 2005
4.711 bln
-922.575 mln
-16.38%
jan 1, 2006
-17.345 bln
-22.056 bln
-468.16%
jan 1, 2007
-17.151 bln
+193.336 mln
-1.11%
jan 1, 2008
-14.399 bln
+2.752 bln
-16.05%
jan 1, 2009
-20.783 bln
-6.383 bln
44.33%
jan 1, 2010
-26.377 bln
-5.594 bln
26.92%
jan 1, 2011
-15.144 bln
+11.232 bln
-42.58%
jan 1, 2012
-5.265 bln
+9.879 bln
-65.24%
jan 1, 2013
-4.998 bln
+266.401 mln
-5.06%
jan 1, 2014
-26.735 bln
-21.736 bln
434.86%
jan 1, 2015
-13.086 bln
+13.649 bln
-51.05%
jan 1, 2016
16.813 bln
+29.899 bln
-228.48%
Ranking of countries by current statistics by years


Comments: