29
/
en
AIzaSyAYiBZKx7MnpbEhh9jyipgxe19OcubqV5w
April 1, 2024
195928
Mexico
MEX
true
2
1
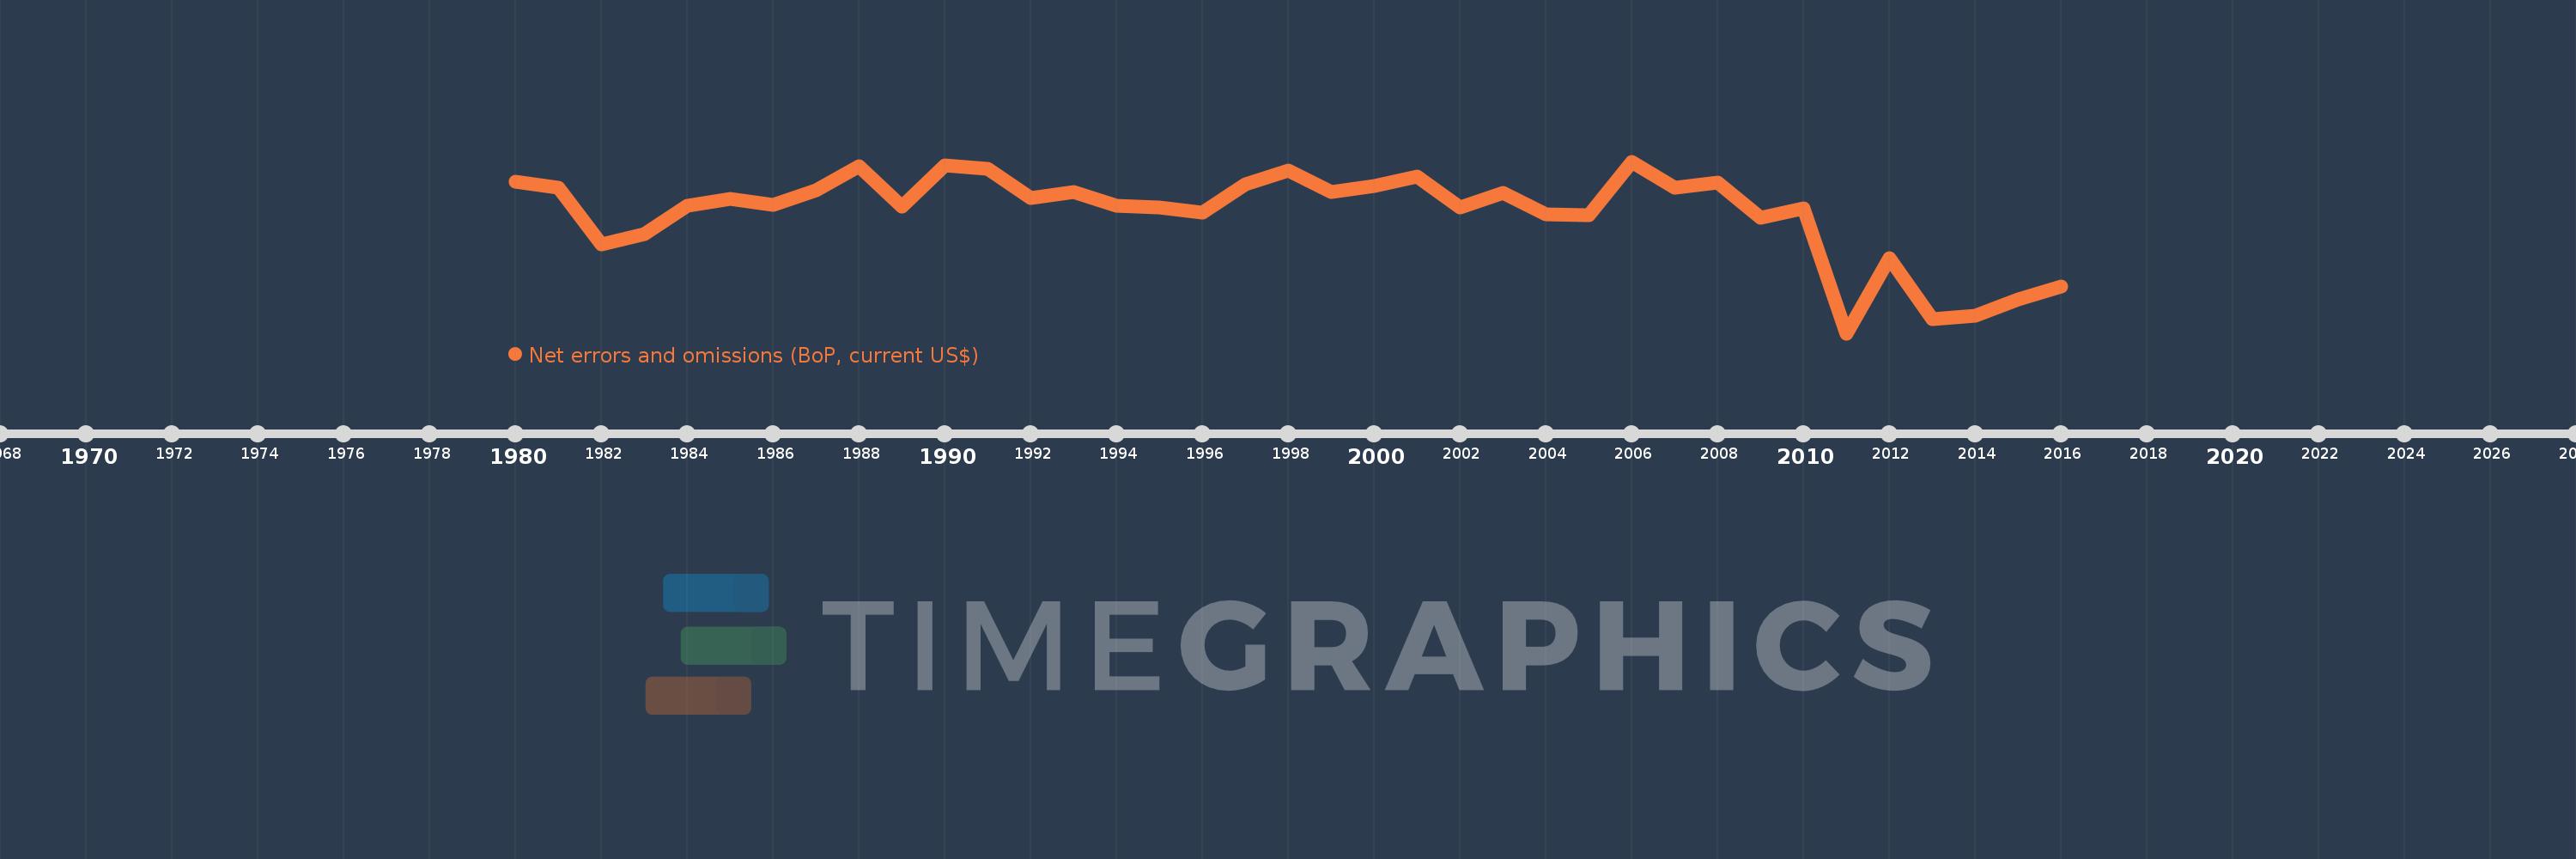
Net errors and omissions (BoP, current US$)
2016,2015,2014,2013,2012,2011,2010,2009,2008,2007,2006,2005,2004,2003,2002,2001,2000,1999,1998,1997,1996,1995,1994,1993,1992,1991,1990,1989,1988,1987,1986,1985,1984,1983,1982,1981,1980
This statistics in other country:
AfghanistanAlbaniaAlgeriaAngolaAntigua and BarbudaArgentinaArmeniaArubaAustraliaAustriaAzerbaijanBahamas, TheBahrainBangladeshBarbadosBelarusBelgiumBelizeBeninBermudaBhutanBoliviaBosnia and HerzegovinaBotswanaBrazilBrunei DarussalamBulgariaBurkina FasoBurundiCabo VerdeCambodiaCameroonCanadaCentral African RepublicChadChileChinaColombiaComorosCongo, Dem. Rep.Congo, Rep.Costa RicaCote d'IvoireCroatiaCuracaoCyprusCzech RepublicDenmarkDjiboutiDominicaDominican RepublicEcuadorEgypt, Arab Rep.El SalvadorEquatorial GuineaEritreaEstoniaEthiopiaEuro areaFijiFinlandFranceFrench PolynesiaGabonGambia, TheGeorgiaGermanyGhanaGreeceGrenadaGuatemalaGuineaGuinea-BissauGuyanaHaitiHondurasHong Kong SAR, ChinaHungaryIcelandIndiaIndonesiaIran, Islamic Rep.IraqIrelandIsraelItalyJamaicaJapanJordanKazakhstanKenyaKiribatiKorea, Rep.KosovoKuwaitKyrgyz RepublicLao PDRLatviaLebanonLesothoLiberiaLibyaLithuaniaLuxembourgMacao SAR, ChinaMacedonia, FYRMadagascarMalawiMalaysiaMaldivesMaliMaltaMarshall IslandsMauritaniaMauritiusMexicoMicronesia, Fed. Sts.MoldovaMongoliaMontenegroMoroccoMozambiqueMyanmarNamibiaNepalNetherlandsNew CaledoniaNew ZealandNicaraguaNigerNigeriaNorwayOmanPakistanPalauPanamaPapua New GuineaParaguayPeruPhilippinesPolandPortugalQatarRomaniaRussian FederationRwandaSamoaSao Tome and PrincipeSaudi ArabiaSenegalSerbiaSeychellesSierra LeoneSingaporeSint Maarten (Dutch part)Slovak RepublicSloveniaSolomon IslandsSouth AfricaSouth SudanSpainSri LankaSt. Kitts and NevisSt. LuciaSt. Vincent and the GrenadinesSudanSurinameSwazilandSwedenSwitzerlandSyrian Arab RepublicTajikistanTanzaniaThailandTimor-LesteTogoTongaTrinidad and TobagoTunisiaTurkeyTuvaluUgandaUkraineUnited KingdomUnited StatesUruguayVanuatuVenezuela, RBVietnamWest Bank and GazaYemen, Rep.ZambiaZimbabwe Timeline:
This timeline shows a graph from 1980 to 2016 of Mexico. No data until 1979. Number of actual observations by date: 37.
Source name:
World Development Indicators
Source organization:
International Monetary Fund, Balance of Payments Statistics Yearbook and data files.
Categories, topics:
Economy & Growth
Last updated:
apr 23, 2017
Indicators value changes by year
Minimum:
-22.817 bln
jan 1, 2011
Maximum:
3.726 bln
jan 1, 2006
At the date of observation
Value
Absolute change
Change from previous value
jan 1, 1980
576.0 mln
+576.0 mln
0.0%
jan 1, 1981
-280.0 mln
-856.0 mln
-148.61%
jan 1, 1982
-9.129 bln
-8.849 bln
3.16K%
jan 1, 1983
-7.453 bln
+1.676 bln
-18.36%
jan 1, 1984
-3.104 bln
+4.349 bln
-58.35%
jan 1, 1985
-2.105 bln
+999.0 mln
-32.18%
jan 1, 1986
-2.915 bln
-810.0 mln
38.48%
jan 1, 1987
-739.0 mln
+2.176 bln
-74.65%
jan 1, 1988
2.969 bln
+3.708 bln
-501.76%
jan 1, 1989
-3.21 bln
-6.179 bln
-208.12%
jan 1, 1990
3.184 bln
+6.394 bln
-199.19%
jan 1, 1991
2.582 bln
-602.0 mln
-18.91%
jan 1, 1992
-1.898 bln
-4.48 bln
-173.51%
jan 1, 1993
-970.0 mln
+928.0 mln
-48.89%
jan 1, 1994
-3.125 bln
-2.155 bln
222.16%
jan 1, 1995
-3.311 bln
-185.96 mln
5.95%
jan 1, 1996
-4.236 bln
-925.49 mln
27.95%
jan 1, 1997
206.747 mln
+4.443 bln
-104.88%
jan 1, 1998
2.396 bln
+2.189 bln
1.06K%
jan 1, 1999
-943.869 mln
-3.34 bln
-139.39%
jan 1, 2000
-53.231 mln
+890.638 mln
-94.36%
jan 1, 2001
1.441 bln
+1.494 bln
-2.81K%
jan 1, 2002
-3.411 bln
-4.852 bln
-336.77%
jan 1, 2003
-1.076 bln
+2.335 bln
-68.46%
jan 1, 2004
-4.435 bln
-3.359 bln
312.21%
jan 1, 2005
-4.562 bln
-127.679 mln
2.88%
jan 1, 2006
3.726 bln
+8.288 bln
-181.67%
jan 1, 2007
-364.978 mln
-4.091 bln
-109.8%
jan 1, 2008
518.12 mln
+883.098 mln
-241.96%
jan 1, 2009
-4.924 bln
-5.442 bln
-1.05K%
jan 1, 2010
-3.554 bln
+1.37 bln
-27.81%
jan 1, 2011
-22.817 bln
-19.263 bln
541.93%
jan 1, 2012
-11.255 bln
+11.562 bln
-50.67%
jan 1, 2013
-20.651 bln
-9.395 bln
83.48%
jan 1, 2014
-20.128 bln
+522.336 mln
-2.53%
jan 1, 2015
-17.566 bln
+2.562 bln
-12.73%
jan 1, 2016
-15.589 bln
+1.977 bln
-11.26%
Ranking of countries by current statistics by years


Comments: