29
/
en
AIzaSyAYiBZKx7MnpbEhh9jyipgxe19OcubqV5w
April 1, 2024
106320
China
CHN
true
2
1
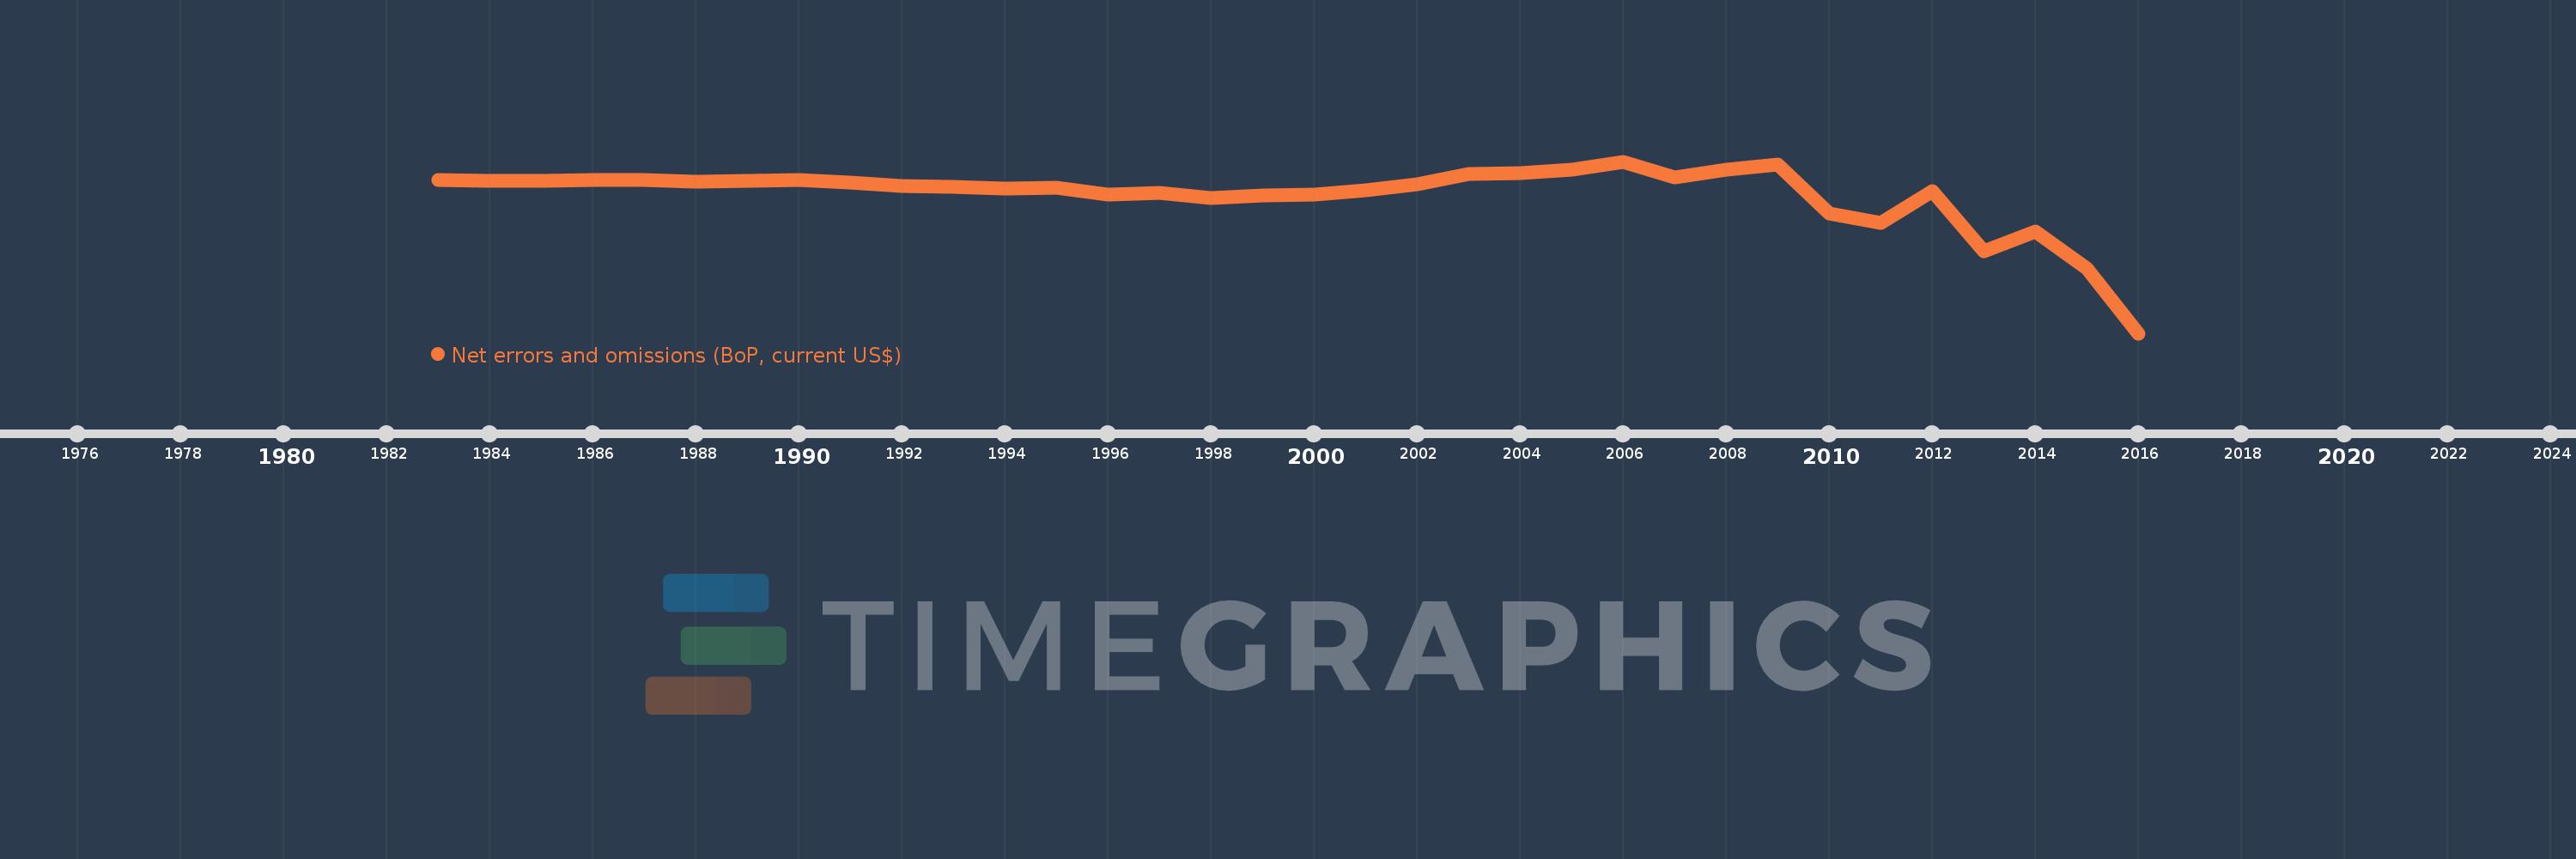
Net errors and omissions (BoP, current US$)
2016,2015,2014,2013,2012,2011,2010,2009,2008,2007,2006,2005,2004,2003,2002,2001,2000,1999,1998,1997,1996,1995,1994,1993,1992,1991,1990,1989,1988,1987,1986,1985,1984,1983
This statistics in other country:
AfghanistanAlbaniaAlgeriaAngolaAntigua and BarbudaArgentinaArmeniaArubaAustraliaAustriaAzerbaijanBahamas, TheBahrainBangladeshBarbadosBelarusBelgiumBelizeBeninBermudaBhutanBoliviaBosnia and HerzegovinaBotswanaBrazilBrunei DarussalamBulgariaBurkina FasoBurundiCabo VerdeCambodiaCameroonCanadaCentral African RepublicChadChileChinaColombiaComorosCongo, Dem. Rep.Congo, Rep.Costa RicaCote d'IvoireCroatiaCuracaoCyprusCzech RepublicDenmarkDjiboutiDominicaDominican RepublicEcuadorEgypt, Arab Rep.El SalvadorEquatorial GuineaEritreaEstoniaEthiopiaEuro areaFijiFinlandFranceFrench PolynesiaGabonGambia, TheGeorgiaGermanyGhanaGreeceGrenadaGuatemalaGuineaGuinea-BissauGuyanaHaitiHondurasHong Kong SAR, ChinaHungaryIcelandIndiaIndonesiaIran, Islamic Rep.IraqIrelandIsraelItalyJamaicaJapanJordanKazakhstanKenyaKiribatiKorea, Rep.KosovoKuwaitKyrgyz RepublicLao PDRLatviaLebanonLesothoLiberiaLibyaLithuaniaLuxembourgMacao SAR, ChinaMacedonia, FYRMadagascarMalawiMalaysiaMaldivesMaliMaltaMarshall IslandsMauritaniaMauritiusMexicoMicronesia, Fed. Sts.MoldovaMongoliaMontenegroMoroccoMozambiqueMyanmarNamibiaNepalNetherlandsNew CaledoniaNew ZealandNicaraguaNigerNigeriaNorwayOmanPakistanPalauPanamaPapua New GuineaParaguayPeruPhilippinesPolandPortugalQatarRomaniaRussian FederationRwandaSamoaSao Tome and PrincipeSaudi ArabiaSenegalSerbiaSeychellesSierra LeoneSingaporeSint Maarten (Dutch part)Slovak RepublicSloveniaSolomon IslandsSouth AfricaSouth SudanSpainSri LankaSt. Kitts and NevisSt. LuciaSt. Vincent and the GrenadinesSudanSurinameSwazilandSwedenSwitzerlandSyrian Arab RepublicTajikistanTanzaniaThailandTimor-LesteTogoTongaTrinidad and TobagoTunisiaTurkeyTuvaluUgandaUkraineUnited KingdomUnited StatesUruguayVanuatuVenezuela, RBVietnamWest Bank and GazaYemen, Rep.ZambiaZimbabwe Timeline:
This timeline shows a graph from 1983 to 2016 of China. No data until 1982. Number of actual observations by date: 34.
Source name:
World Development Indicators
Source organization:
International Monetary Fund, Balance of Payments Statistics Yearbook and data files.
Categories, topics:
Economy & Growth
Last updated:
apr 23, 2017
Indicators value changes by year
Minimum:
-188.244 bln
jan 1, 2016
Maximum:
22.921 bln
jan 1, 2006
At the date of observation
Value
Absolute change
Change from previous value
jan 1, 1983
279.0 mln
+279.0 mln
0.0%
jan 1, 1984
-366.0 mln
-645.0 mln
-231.18%
jan 1, 1985
-932.0 mln
-566.0 mln
154.64%
jan 1, 1986
93.0 mln
+1.025 bln
-109.98%
jan 1, 1987
-185.0 mln
-278.0 mln
-298.92%
jan 1, 1988
-1.449 bln
-1.264 bln
683.24%
jan 1, 1989
-1.095 bln
+354.0 mln
-24.43%
jan 1, 1990
-20.0 mln
+1.075 bln
-98.17%
jan 1, 1991
-3.125 bln
-3.105 bln
15.53K%
jan 1, 1992
-6.803 bln
-3.678 bln
117.7%
jan 1, 1993
-8.273 bln
-1.47 bln
21.61%
jan 1, 1994
-10.098 bln
-1.825 bln
22.06%
jan 1, 1995
-9.026 bln
+1.072 bln
-10.62%
jan 1, 1996
-17.811 bln
-8.785 bln
97.33%
jan 1, 1997
-15.558 bln
+2.253 bln
-12.65%
jan 1, 1998
-22.276 bln
-6.718 bln
43.18%
jan 1, 1999
-18.771 bln
+3.505 bln
-15.73%
jan 1, 2000
-17.814 bln
+957.0 mln
-5.1%
jan 1, 2001
-11.928 bln
+5.886 bln
-33.04%
jan 1, 2002
-4.908 bln
+7.02 bln
-58.85%
jan 1, 2003
7.744 bln
+12.652 bln
-257.78%
jan 1, 2004
8.224 bln
+479.846 mln
6.2%
jan 1, 2005
12.967 bln
+4.743 bln
57.68%
jan 1, 2006
22.921 bln
+9.954 bln
76.77%
jan 1, 2007
3.628 bln
-19.293 bln
-84.17%
jan 1, 2008
13.29 bln
+9.662 bln
266.31%
jan 1, 2009
18.844 bln
+5.554 bln
41.79%
jan 1, 2010
-41.383 bln
-60.227 bln
-319.6%
jan 1, 2011
-52.936 bln
-11.553 bln
27.92%
jan 1, 2012
-13.766 bln
+39.17 bln
-74.0%
jan 1, 2013
-87.074 bln
-73.309 bln
532.54%
jan 1, 2014
-62.925 bln
+24.15 bln
-27.73%
jan 1, 2015
-108.26 bln
-45.335 bln
72.05%
jan 1, 2016
-188.244 bln
-79.984 bln
73.88%
Ranking of countries by current statistics by years


Comments: