29
/
en
AIzaSyAYiBZKx7MnpbEhh9jyipgxe19OcubqV5w
April 1, 2024
87605
Bolivia
BOL
true
2
1
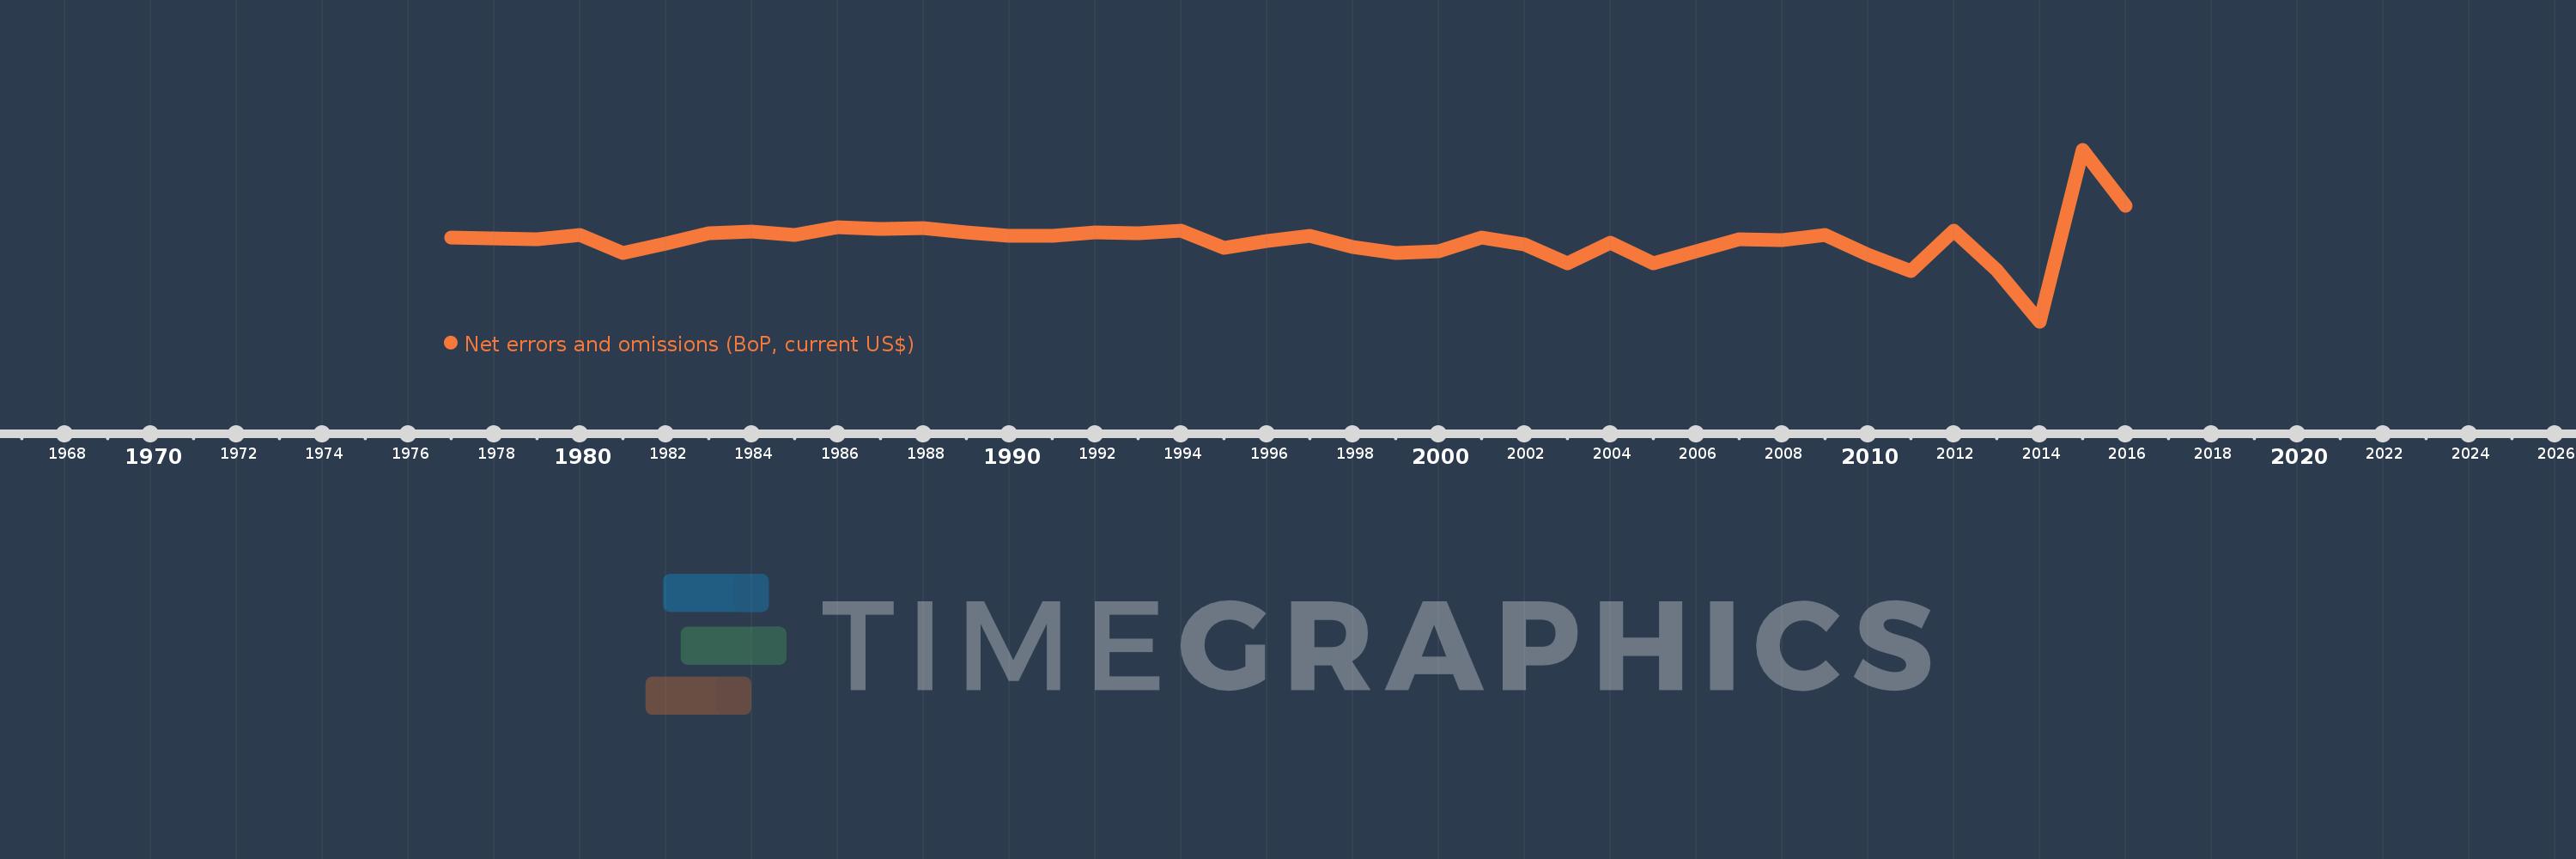
Net errors and omissions (BoP, current US$)
2016,2015,2014,2013,2012,2011,2010,2009,2008,2007,2006,2005,2004,2003,2002,2001,2000,1999,1998,1997,1996,1995,1994,1993,1992,1991,1990,1989,1988,1987,1986,1985,1984,1983,1982,1981,1980,1979,1978,1977
This statistics in other country:
AfghanistanAlbaniaAlgeriaAngolaAntigua and BarbudaArgentinaArmeniaArubaAustraliaAustriaAzerbaijanBahamas, TheBahrainBangladeshBarbadosBelarusBelgiumBelizeBeninBermudaBhutanBoliviaBosnia and HerzegovinaBotswanaBrazilBrunei DarussalamBulgariaBurkina FasoBurundiCabo VerdeCambodiaCameroonCanadaCentral African RepublicChadChileChinaColombiaComorosCongo, Dem. Rep.Congo, Rep.Costa RicaCote d'IvoireCroatiaCuracaoCyprusCzech RepublicDenmarkDjiboutiDominicaDominican RepublicEcuadorEgypt, Arab Rep.El SalvadorEquatorial GuineaEritreaEstoniaEthiopiaEuro areaFijiFinlandFranceFrench PolynesiaGabonGambia, TheGeorgiaGermanyGhanaGreeceGrenadaGuatemalaGuineaGuinea-BissauGuyanaHaitiHondurasHong Kong SAR, ChinaHungaryIcelandIndiaIndonesiaIran, Islamic Rep.IraqIrelandIsraelItalyJamaicaJapanJordanKazakhstanKenyaKiribatiKorea, Rep.KosovoKuwaitKyrgyz RepublicLao PDRLatviaLebanonLesothoLiberiaLibyaLithuaniaLuxembourgMacao SAR, ChinaMacedonia, FYRMadagascarMalawiMalaysiaMaldivesMaliMaltaMarshall IslandsMauritaniaMauritiusMexicoMicronesia, Fed. Sts.MoldovaMongoliaMontenegroMoroccoMozambiqueMyanmarNamibiaNepalNetherlandsNew CaledoniaNew ZealandNicaraguaNigerNigeriaNorwayOmanPakistanPalauPanamaPapua New GuineaParaguayPeruPhilippinesPolandPortugalQatarRomaniaRussian FederationRwandaSamoaSao Tome and PrincipeSaudi ArabiaSenegalSerbiaSeychellesSierra LeoneSingaporeSint Maarten (Dutch part)Slovak RepublicSloveniaSolomon IslandsSouth AfricaSouth SudanSpainSri LankaSt. Kitts and NevisSt. LuciaSt. Vincent and the GrenadinesSudanSurinameSwazilandSwedenSwitzerlandSyrian Arab RepublicTajikistanTanzaniaThailandTimor-LesteTogoTongaTrinidad and TobagoTunisiaTurkeyTuvaluUgandaUkraineUnited KingdomUnited StatesUruguayVanuatuVenezuela, RBVietnamWest Bank and GazaYemen, Rep.ZambiaZimbabwe Timeline:
This timeline shows a graph from 1977 to 2016 of Bolivia. No data until 1976. Number of actual observations by date: 40.
Source name:
World Development Indicators
Source organization:
International Monetary Fund, Balance of Payments Statistics Yearbook and data files.
Categories, topics:
Economy & Growth
Last updated:
apr 23, 2017
Indicators value changes by year
Minimum:
-1.952 bln
jan 1, 2014
Maximum:
1.912 bln
jan 1, 2015
At the date of observation
Value
Absolute change
Change from previous value
jan 1, 1977
-57.0 mln
-57.0 mln
0.0%
jan 1, 1978
-77.9 mln
-20.9 mln
36.67%
jan 1, 1979
-87.6 mln
-9.7 mln
12.45%
jan 1, 1980
-2.5 mln
+85.1 mln
-97.15%
jan 1, 1981
-405.2 mln
-402.7 mln
16.11K%
jan 1, 1982
-185.155 mln
+220.045 mln
-54.31%
jan 1, 1983
40.125 mln
+225.28 mln
-121.67%
jan 1, 1984
80.034 mln
+39.909 mln
99.46%
jan 1, 1985
-4.391 mln
-84.425 mln
-105.49%
jan 1, 1986
187.9 mln
+192.291 mln
-4.38K%
jan 1, 1987
133.163 mln
-54.737 mln
-29.13%
jan 1, 1988
156.536 mln
+23.373 mln
17.55%
jan 1, 1989
55.256 mln
-101.28 mln
-64.7%
jan 1, 1990
-16.9 mln
-72.156 mln
-130.58%
jan 1, 1991
-13.3 mln
+3.6 mln
-21.3%
jan 1, 1992
53.7 mln
+67.0 mln
-503.76%
jan 1, 1993
35.7 mln
-18.0 mln
-33.52%
jan 1, 1994
97.45 mln
+61.75 mln
172.97%
jan 1, 1995
-289.7 mln
-387.15 mln
-397.28%
jan 1, 1996
-123.7 mln
+166.0 mln
-57.3%
jan 1, 1997
-21.23 mln
+102.47 mln
-82.84%
jan 1, 1998
-258.9 mln
-237.67 mln
1.12K%
jan 1, 1999
-400.23 mln
-141.33 mln
54.59%
jan 1, 2000
-353.8 mln
+46.43 mln
-11.6%
jan 1, 2001
-53.924 mln
+299.876 mln
-84.76%
jan 1, 2002
-202.745 mln
-148.821 mln
275.98%
jan 1, 2003
-639.463 mln
-436.718 mln
215.4%
jan 1, 2004
-171.539 mln
+467.924 mln
-73.17%
jan 1, 2005
-627.792 mln
-456.252 mln
265.98%
jan 1, 2006
-363.092 mln
+264.7 mln
-42.16%
jan 1, 2007
-96.129 mln
+266.963 mln
-73.52%
jan 1, 2008
-102.556 mln
-6.427 mln
6.69%
jan 1, 2009
11.014 mln
+113.57 mln
-110.74%
jan 1, 2010
-442.82 mln
-453.834 mln
-4.12K%
jan 1, 2011
-809.464 mln
-366.644 mln
82.8%
jan 1, 2012
100.639 mln
+910.103 mln
-112.43%
jan 1, 2013
-794.646 mln
-895.285 mln
-889.6%
jan 1, 2014
-1.952 bln
-1.157 bln
145.66%
jan 1, 2015
1.912 bln
+3.864 bln
-197.93%
jan 1, 2016
653.172 mln
-1.258 bln
-65.83%
Ranking of countries by current statistics by years


Comments: