29
/
en
AIzaSyAYiBZKx7MnpbEhh9jyipgxe19OcubqV5w
April 1, 2024
76463
Bahamas, The
BHS
true
2
1
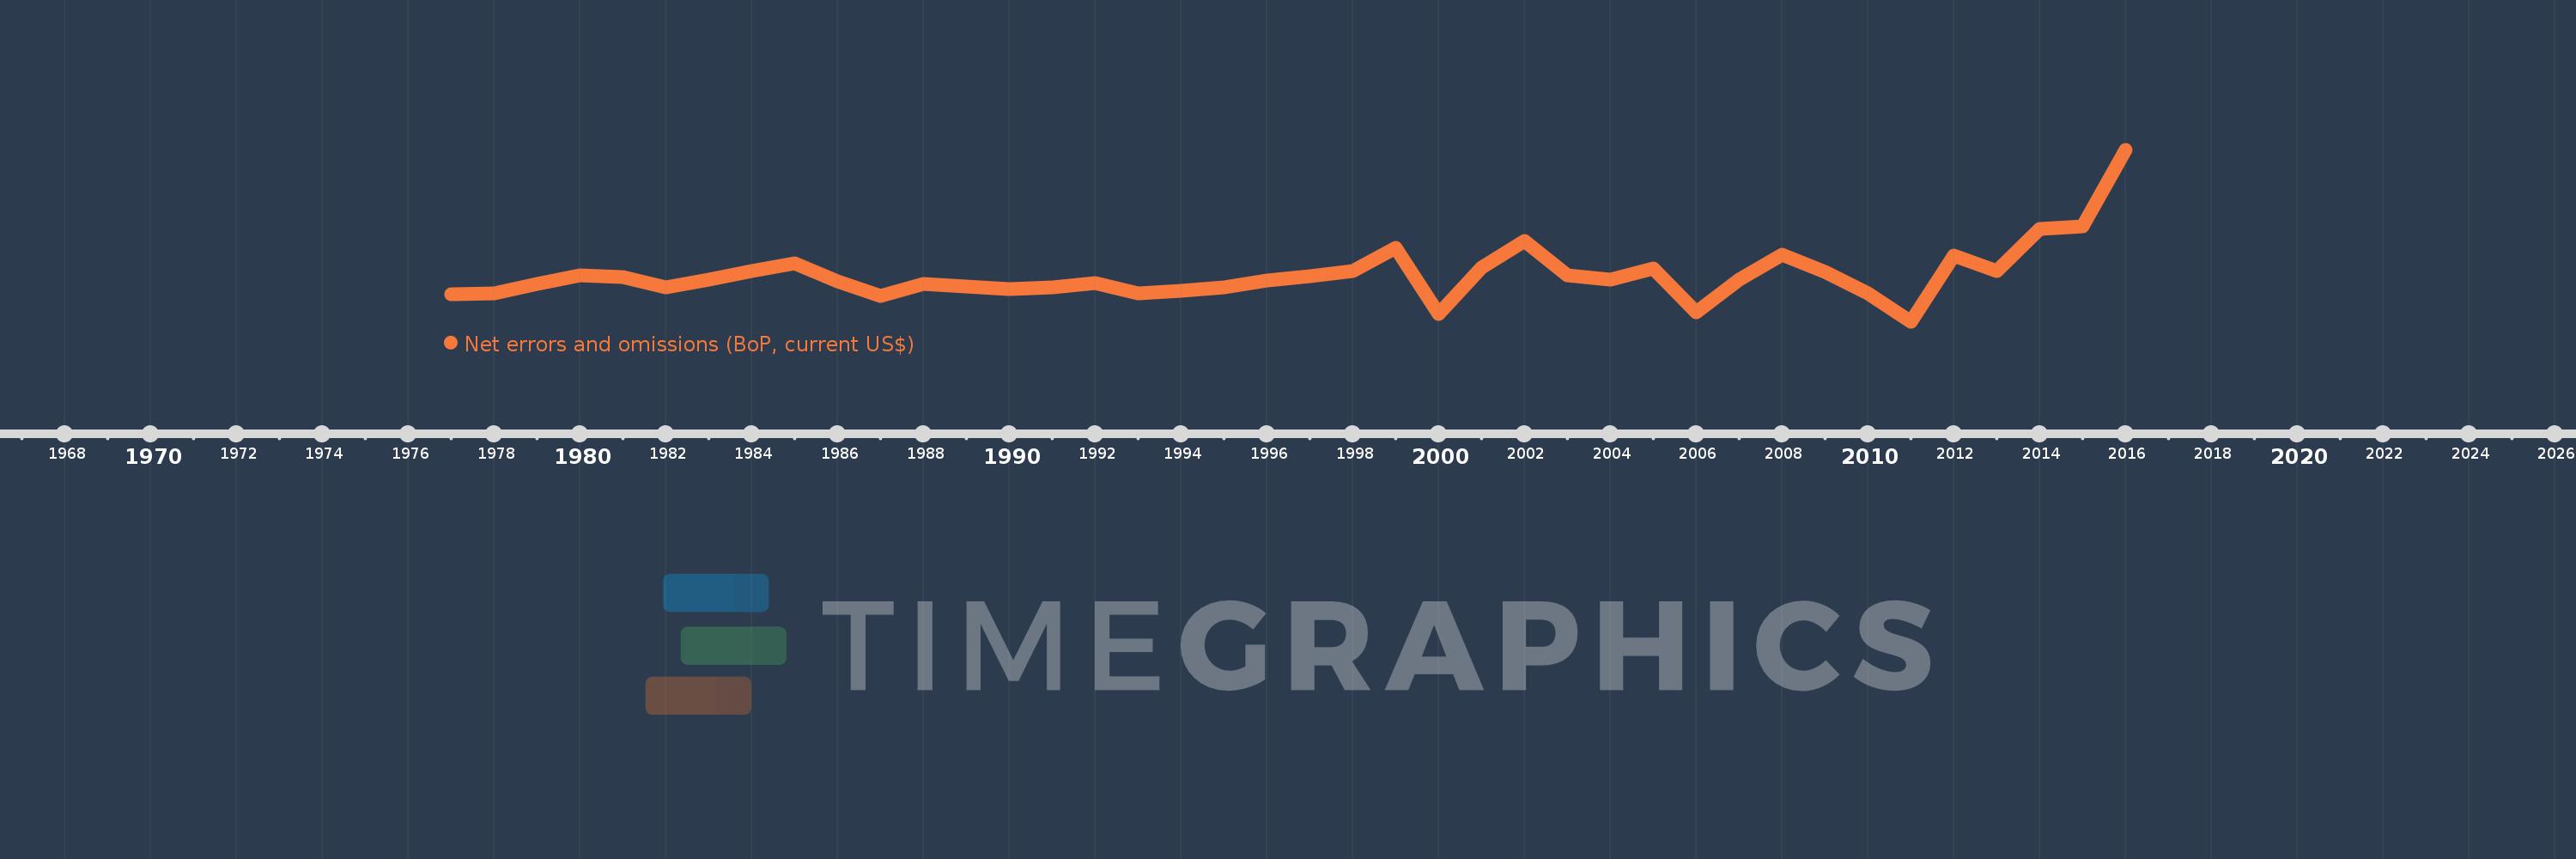
Net errors and omissions (BoP, current US$)
2016,2015,2014,2013,2012,2011,2010,2009,2008,2007,2006,2005,2004,2003,2002,2001,2000,1999,1998,1997,1996,1995,1994,1993,1992,1991,1990,1989,1988,1987,1986,1985,1984,1983,1982,1981,1980,1979,1978,1977
This statistics in other country:
AfghanistanAlbaniaAlgeriaAngolaAntigua and BarbudaArgentinaArmeniaArubaAustraliaAustriaAzerbaijanBahamas, TheBahrainBangladeshBarbadosBelarusBelgiumBelizeBeninBermudaBhutanBoliviaBosnia and HerzegovinaBotswanaBrazilBrunei DarussalamBulgariaBurkina FasoBurundiCabo VerdeCambodiaCameroonCanadaCentral African RepublicChadChileChinaColombiaComorosCongo, Dem. Rep.Congo, Rep.Costa RicaCote d'IvoireCroatiaCuracaoCyprusCzech RepublicDenmarkDjiboutiDominicaDominican RepublicEcuadorEgypt, Arab Rep.El SalvadorEquatorial GuineaEritreaEstoniaEthiopiaEuro areaFijiFinlandFranceFrench PolynesiaGabonGambia, TheGeorgiaGermanyGhanaGreeceGrenadaGuatemalaGuineaGuinea-BissauGuyanaHaitiHondurasHong Kong SAR, ChinaHungaryIcelandIndiaIndonesiaIran, Islamic Rep.IraqIrelandIsraelItalyJamaicaJapanJordanKazakhstanKenyaKiribatiKorea, Rep.KosovoKuwaitKyrgyz RepublicLao PDRLatviaLebanonLesothoLiberiaLibyaLithuaniaLuxembourgMacao SAR, ChinaMacedonia, FYRMadagascarMalawiMalaysiaMaldivesMaliMaltaMarshall IslandsMauritaniaMauritiusMexicoMicronesia, Fed. Sts.MoldovaMongoliaMontenegroMoroccoMozambiqueMyanmarNamibiaNepalNetherlandsNew CaledoniaNew ZealandNicaraguaNigerNigeriaNorwayOmanPakistanPalauPanamaPapua New GuineaParaguayPeruPhilippinesPolandPortugalQatarRomaniaRussian FederationRwandaSamoaSao Tome and PrincipeSaudi ArabiaSenegalSerbiaSeychellesSierra LeoneSingaporeSint Maarten (Dutch part)Slovak RepublicSloveniaSolomon IslandsSouth AfricaSouth SudanSpainSri LankaSt. Kitts and NevisSt. LuciaSt. Vincent and the GrenadinesSudanSurinameSwazilandSwedenSwitzerlandSyrian Arab RepublicTajikistanTanzaniaThailandTimor-LesteTogoTongaTrinidad and TobagoTunisiaTurkeyTuvaluUgandaUkraineUnited KingdomUnited StatesUruguayVanuatuVenezuela, RBVietnamWest Bank and GazaYemen, Rep.ZambiaZimbabwe Timeline:
This timeline shows a graph from 1977 to 2016 of Bahamas, The. No data until 1976. Number of actual observations by date: 40.
Source name:
World Development Indicators
Source organization:
International Monetary Fund, Balance of Payments Statistics Yearbook and data files.
Categories, topics:
Economy & Growth
Last updated:
apr 23, 2017
Indicators value changes by year
Minimum:
-286.344 mln
jan 1, 2011
Maximum:
1.063 bln
jan 1, 2016
At the date of observation
Value
Absolute change
Change from previous value
jan 1, 1977
-71.6 mln
-71.6 mln
0.0%
jan 1, 1978
-60.2 mln
+11.4 mln
-15.92%
jan 1, 1979
13.4 mln
+73.6 mln
-122.26%
jan 1, 1980
82.0 mln
+68.6 mln
511.94%
jan 1, 1981
69.2 mln
-12.8 mln
-15.61%
jan 1, 1982
-17.6 mln
-86.8 mln
-125.43%
jan 1, 1983
46.1 mln
+63.7 mln
-361.93%
jan 1, 1984
111.2 mln
+65.1 mln
141.21%
jan 1, 1985
173.0 mln
+61.8 mln
55.58%
jan 1, 1986
32.8 mln
-140.2 mln
-81.04%
jan 1, 1987
-80.11 mln
-112.91 mln
-344.24%
jan 1, 1988
9.9 mln
+90.01 mln
-112.36%
jan 1, 1989
-5.2 mln
-15.1 mln
-152.53%
jan 1, 1990
-30.6 mln
-25.4 mln
488.46%
jan 1, 1991
-17.6 mln
+13.0 mln
-42.48%
jan 1, 1992
19.0 mln
+36.6 mln
-207.95%
jan 1, 1993
-58.6 mln
-77.6 mln
-408.42%
jan 1, 1994
-39.96 mln
+18.64 mln
-31.81%
jan 1, 1995
-15.5 mln
+24.46 mln
-61.21%
jan 1, 1996
38.4 mln
+53.9 mln
-347.74%
jan 1, 1997
74.6 mln
+36.2 mln
94.27%
jan 1, 1998
116.6 mln
+42.0 mln
56.3%
jan 1, 1999
296.9 mln
+180.3 mln
154.63%
jan 1, 2000
-226.502 mln
-523.402 mln
-176.29%
jan 1, 2001
141.533 mln
+368.035 mln
-162.49%
jan 1, 2002
349.16 mln
+207.627 mln
146.7%
jan 1, 2003
79.038 mln
-270.122 mln
-77.36%
jan 1, 2004
48.92 mln
-30.118 mln
-38.11%
jan 1, 2005
132.3 mln
+83.38 mln
170.44%
jan 1, 2006
-210.346 mln
-342.646 mln
-258.99%
jan 1, 2007
44.5 mln
+254.846 mln
-121.16%
jan 1, 2008
238.688 mln
+194.188 mln
436.38%
jan 1, 2009
107.585 mln
-131.103 mln
-54.93%
jan 1, 2010
-59.783 mln
-167.368 mln
-155.57%
jan 1, 2011
-286.344 mln
-226.561 mln
378.97%
jan 1, 2012
235.579 mln
+521.923 mln
-182.27%
jan 1, 2013
116.487 mln
-119.092 mln
-50.55%
jan 1, 2014
444.495 mln
+328.008 mln
281.58%
jan 1, 2015
464.984 mln
+20.489 mln
4.61%
jan 1, 2016
1.063 bln
+598.256 mln
128.66%
Ranking of countries by current statistics by years


Comments: