29
/
en
AIzaSyAYiBZKx7MnpbEhh9jyipgxe19OcubqV5w
April 1, 2024
209023
New Zealand
NZL
true
2
1
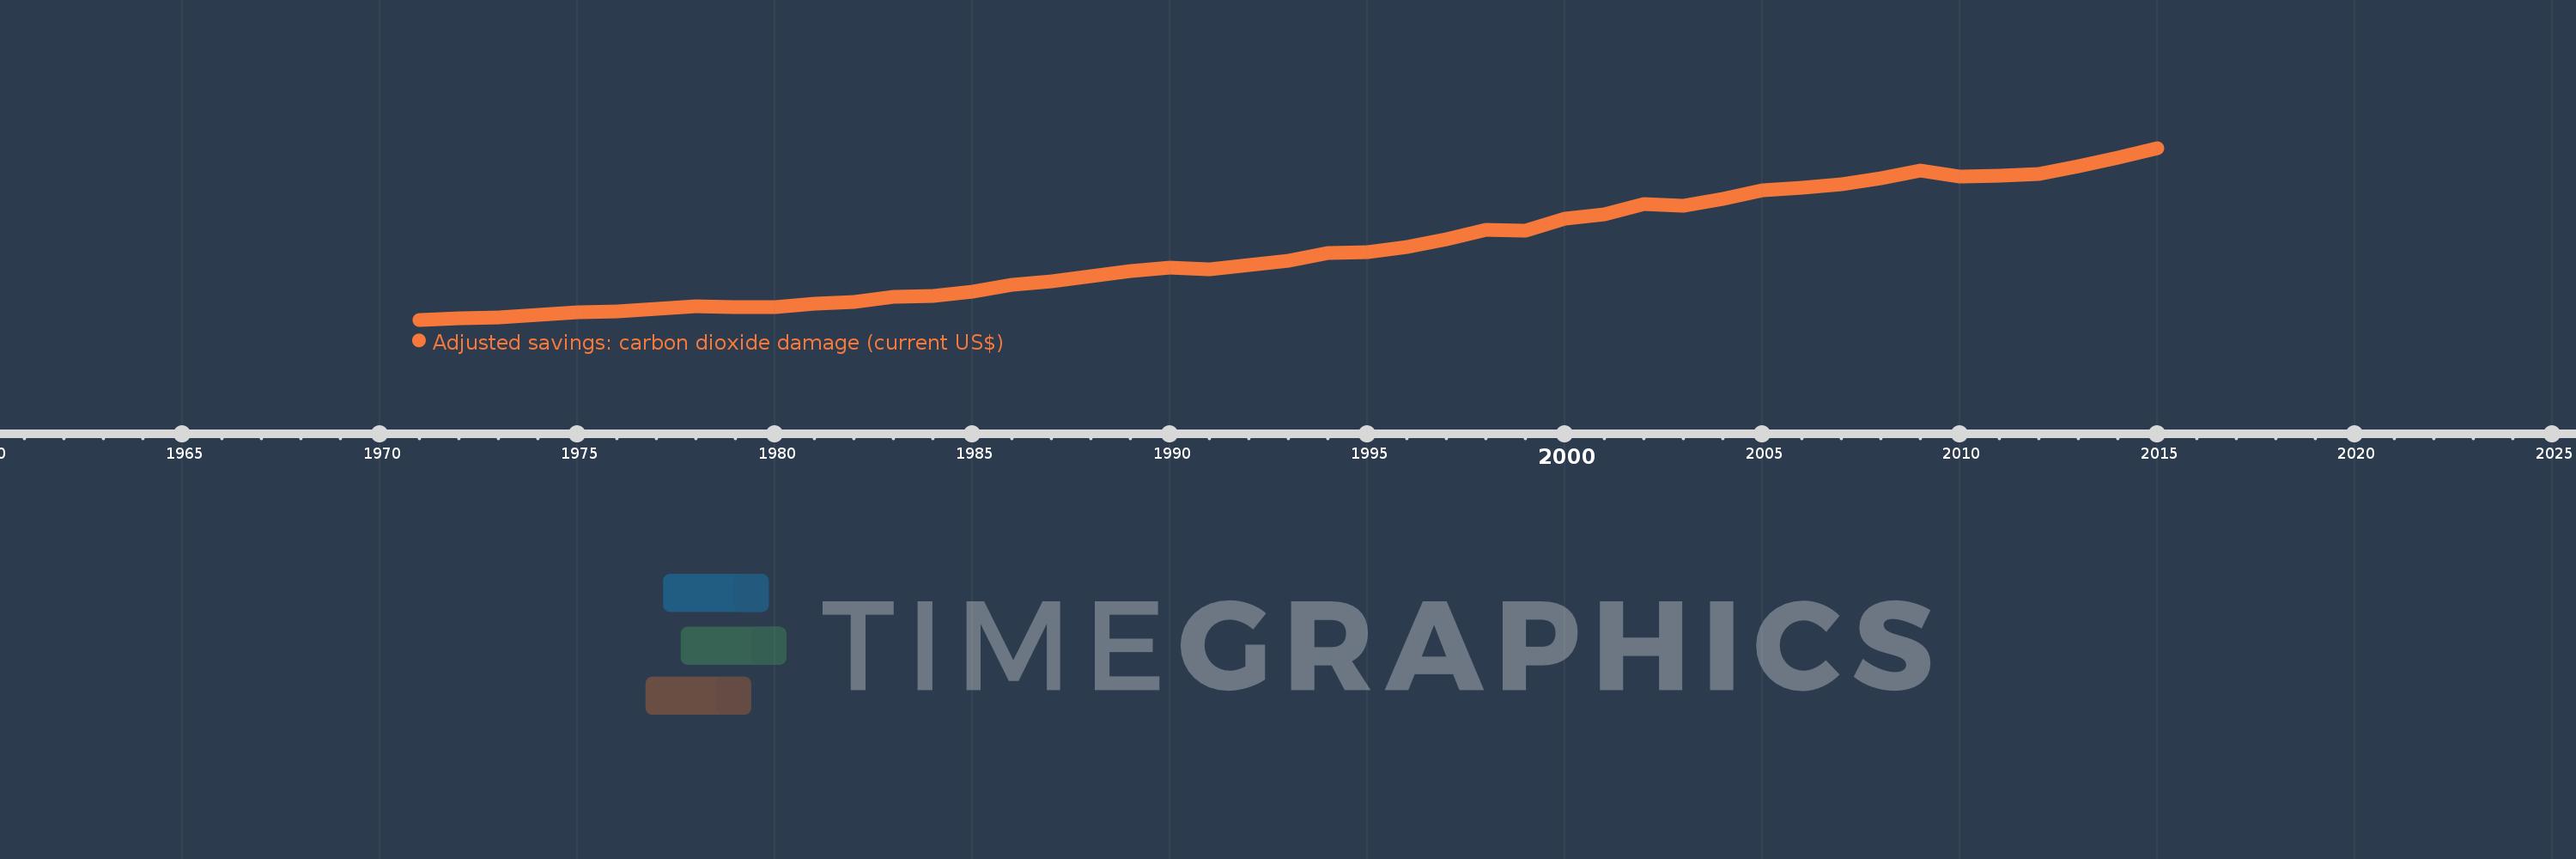
Adjusted savings: carbon dioxide damage (current US$)
2015,2014,2013,2012,2011,2010,2009,2008,2007,2006,2005,2004,2003,2002,2001,2000,1999,1998,1997,1996,1995,1994,1993,1992,1991,1990,1989,1988,1987,1986,1985,1984,1983,1982,1981,1980,1979,1978,1977,1976,1975,1974,1973,1972,1971
This statistics in other country:
AfghanistanAlbaniaAlgeriaAndorraAngolaAntigua and BarbudaArgentinaArmeniaArubaAustraliaAustriaAzerbaijanBahamas, TheBahrainBangladeshBarbadosBelarusBelgiumBelizeBeninBermudaBhutanBoliviaBosnia and HerzegovinaBotswanaBrazilBrunei DarussalamBulgariaBurkina FasoBurundiCabo VerdeCambodiaCameroonCanadaCayman IslandsCentral African RepublicChadChileChinaColombiaComorosCongo, Dem. Rep.Congo, Rep.Costa RicaCote d'IvoireCroatiaCubaCyprusCzech RepublicDenmarkDjiboutiDominicaDominican RepublicEcuadorEgypt, Arab Rep.El SalvadorEquatorial GuineaEritreaEstoniaEthiopiaFaroe IslandsFijiFinlandFranceFrench PolynesiaGabonGambia, TheGeorgiaGermanyGhanaGibraltarGreeceGreenlandGrenadaGuatemalaGuineaGuinea-BissauGuyanaHaitiHondurasHong Kong SAR, ChinaHungaryIcelandIndiaIndonesiaIran, Islamic Rep.IraqIrelandIsraelItalyJamaicaJapanJordanKazakhstanKenyaKiribatiKorea, Dem. People’s Rep.Korea, Rep.KuwaitKyrgyz RepublicLao PDRLatviaLebanonLesothoLiberiaLibyaLiechtensteinLithuaniaLuxembourgMacao SAR, ChinaMacedonia, FYRMadagascarMalawiMalaysiaMaldivesMaliMaltaMarshall IslandsMauritaniaMauritiusMexicoMicronesia, Fed. Sts.MoldovaMongoliaMontenegroMoroccoMozambiqueMyanmarNamibiaNepalNetherlandsNew CaledoniaNew ZealandNicaraguaNigerNigeriaNorwayOmanPakistanPalauPanamaPapua New GuineaParaguayPeruPhilippinesPolandPortugalQatarRomaniaRussian FederationRwandaSamoaSao Tome and PrincipeSaudi ArabiaSenegalSerbiaSeychellesSierra LeoneSingaporeSlovak RepublicSloveniaSolomon IslandsSomaliaSouth AfricaSpainSri LankaSt. Kitts and NevisSt. LuciaSt. Vincent and the GrenadinesSudanSurinameSwazilandSwedenSwitzerlandSyrian Arab RepublicTajikistanTanzaniaThailandTimor-LesteTogoTongaTrinidad and TobagoTunisiaTurkeyTurkmenistanTurks and Caicos IslandsUgandaUkraineUnited Arab EmiratesUnited KingdomUnited StatesUruguayUzbekistanVanuatuVenezuela, RBVietnamWest Bank and GazaYemen, Rep.ZambiaZimbabwe Timeline:
This timeline shows a graph from 1971 to 2015 of New Zealand. No data until 1970. Number of actual observations by date: 45.
Source name:
World Development Indicators
Source organization:
World Bank staff estimates based on Samuel Fankhauser's "Valuing Climate Change: The Economics of the Greenhouse" (1995).
Categories, topics:
Economy & Growth, Environment
Last updated:
apr 23, 2017
Indicators value changes by year
Minimum:
18.947 mln
jan 1, 1971
Maximum:
353.127 mln
jan 1, 2015
At the date of observation
Value
Absolute change
Change from previous value
jan 1, 1971
18.947 mln
+18.947 mln
0.0%
jan 1, 1972
21.371 mln
+2.424 mln
12.79%
jan 1, 1973
24.261 mln
+2.89 mln
13.52%
jan 1, 1974
29.088 mln
+4.826 mln
19.89%
jan 1, 1975
33.049 mln
+3.961 mln
13.62%
jan 1, 1976
35.57 mln
+2.521 mln
7.63%
jan 1, 1977
39.991 mln
+4.421 mln
12.43%
jan 1, 1978
45.346 mln
+5.355 mln
13.39%
jan 1, 1979
43.557 mln
-1.789 mln
-3.95%
jan 1, 1980
43.646 mln
+89.462K
0.21%
jan 1, 1981
51.013 mln
+7.367 mln
16.88%
jan 1, 1982
53.42 mln
+2.407 mln
4.72%
jan 1, 1983
63.349 mln
+9.928 mln
18.59%
jan 1, 1984
65.619 mln
+2.27 mln
3.58%
jan 1, 1985
73.84 mln
+8.221 mln
12.53%
jan 1, 1986
87.12 mln
+13.28 mln
17.98%
jan 1, 1987
94.413 mln
+7.294 mln
8.37%
jan 1, 1988
103.169 mln
+8.756 mln
9.27%
jan 1, 1989
113.803 mln
+10.634 mln
10.31%
jan 1, 1990
119.652 mln
+5.848 mln
5.14%
jan 1, 1991
116.929 mln
-2.723 mln
-2.28%
jan 1, 1992
124.892 mln
+7.964 mln
6.81%
jan 1, 1993
134.337 mln
+9.445 mln
7.56%
jan 1, 1994
148.977 mln
+14.64 mln
10.9%
jan 1, 1995
150.977 mln
+2.0 mln
1.34%
jan 1, 1996
160.423 mln
+9.446 mln
6.26%
jan 1, 1997
175.138 mln
+14.716 mln
9.17%
jan 1, 1998
194.036 mln
+18.898 mln
10.79%
jan 1, 1999
191.914 mln
-2.121 mln
-1.09%
jan 1, 2000
215.34 mln
+23.426 mln
12.21%
jan 1, 2001
224.052 mln
+8.712 mln
4.05%
jan 1, 2002
243.221 mln
+19.168 mln
8.56%
jan 1, 2003
240.38 mln
-2.841 mln
-1.17%
jan 1, 2004
253.562 mln
+13.182 mln
5.48%
jan 1, 2005
269.973 mln
+16.411 mln
6.47%
jan 1, 2006
274.936 mln
+4.964 mln
1.84%
jan 1, 2007
283.267 mln
+8.33 mln
3.03%
jan 1, 2008
294.697 mln
+11.43 mln
4.04%
jan 1, 2009
309.23 mln
+14.533 mln
4.93%
jan 1, 2010
296.964 mln
-12.266 mln
-3.97%
jan 1, 2011
298.374 mln
+1.411 mln
0.48%
jan 1, 2012
302.725 mln
+4.351 mln
1.46%
jan 1, 2013
318.181 mln
+15.455 mln
5.11%
jan 1, 2014
334.392 mln
+16.212 mln
5.1%
jan 1, 2015
353.127 mln
+18.735 mln
5.6%
Ranking of countries by current statistics by years


Comments: