29
/
en
AIzaSyAYiBZKx7MnpbEhh9jyipgxe19OcubqV5w
April 1, 2024
132845
Finland
FIN
true
2
1
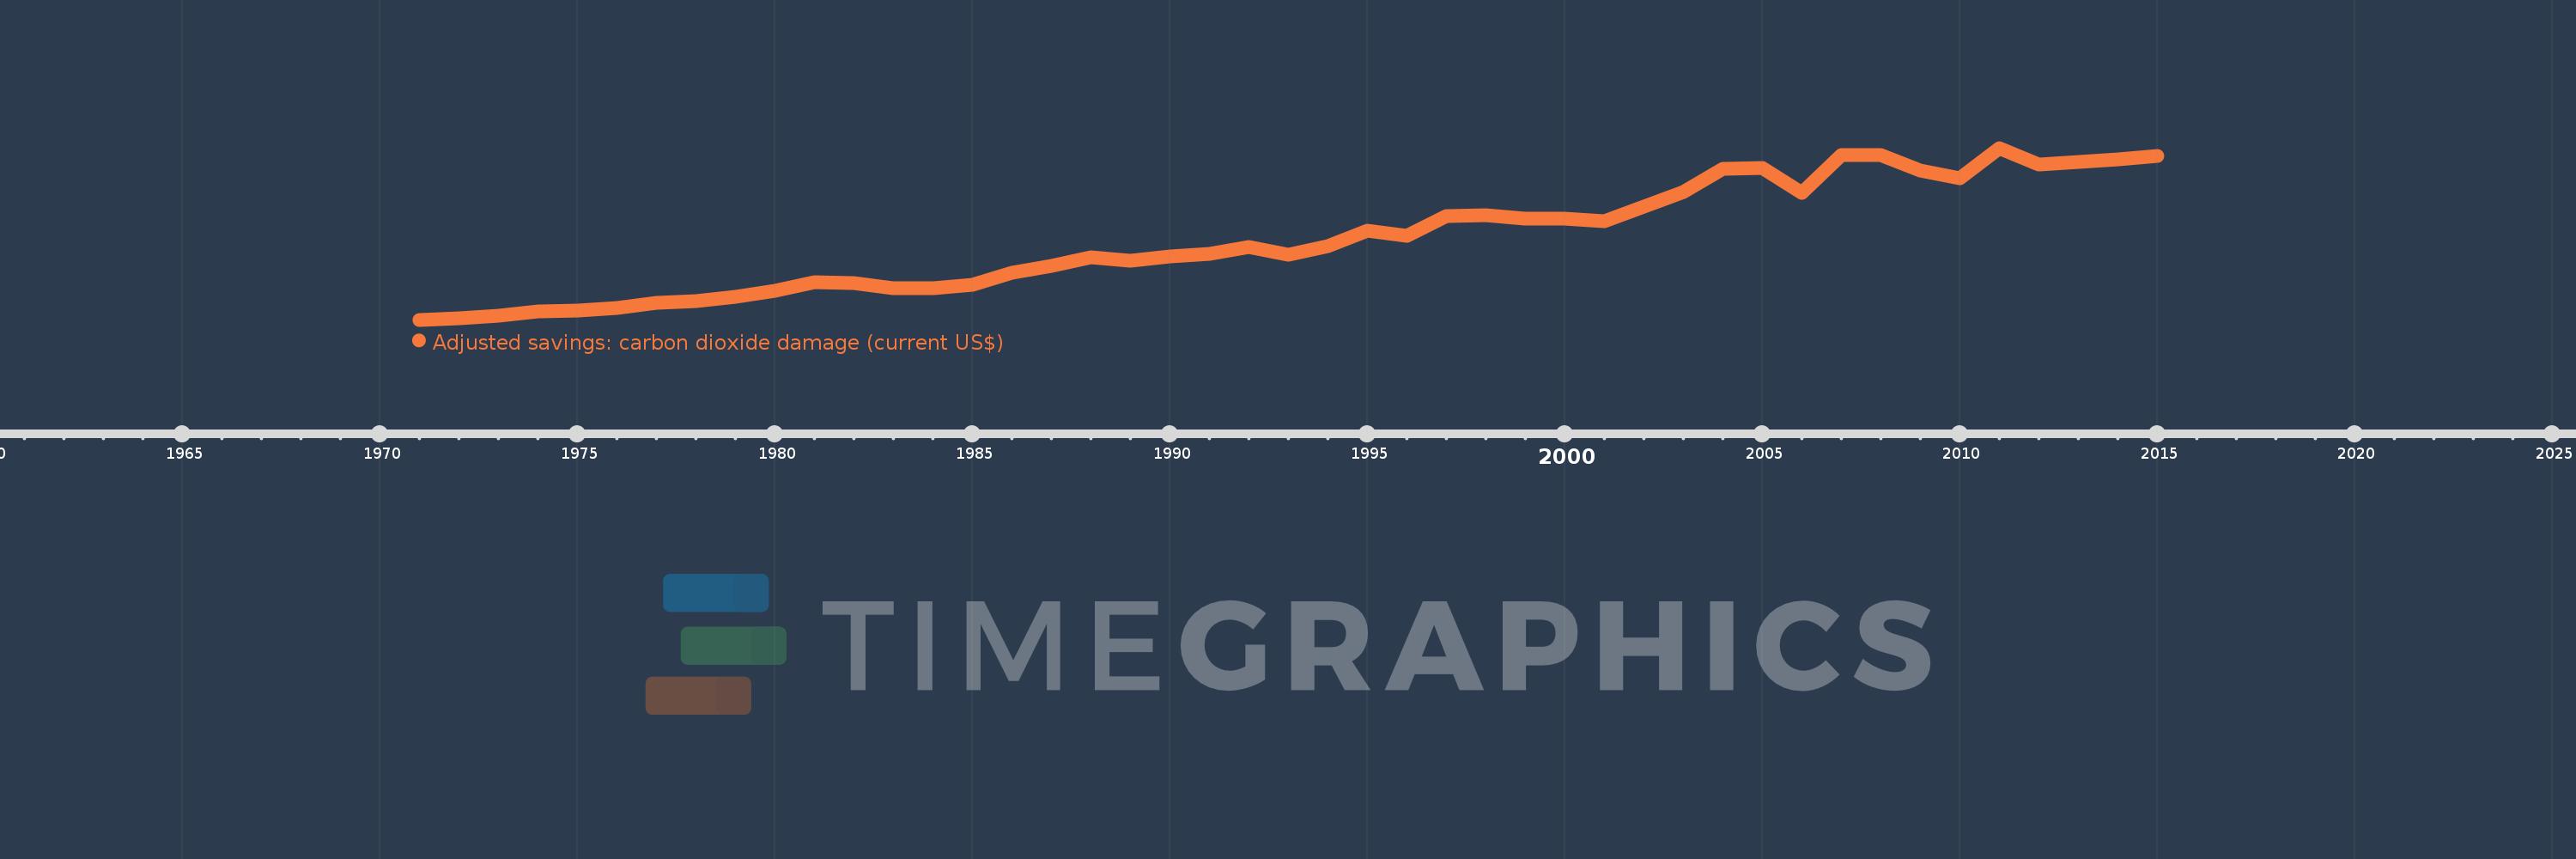
Adjusted savings: carbon dioxide damage (current US$)
2015,2014,2013,2012,2011,2010,2009,2008,2007,2006,2005,2004,2003,2002,2001,2000,1999,1998,1997,1996,1995,1994,1993,1992,1991,1990,1989,1988,1987,1986,1985,1984,1983,1982,1981,1980,1979,1978,1977,1976,1975,1974,1973,1972,1971
This statistics in other country:
AfghanistanAlbaniaAlgeriaAndorraAngolaAntigua and BarbudaArgentinaArmeniaArubaAustraliaAustriaAzerbaijanBahamas, TheBahrainBangladeshBarbadosBelarusBelgiumBelizeBeninBermudaBhutanBoliviaBosnia and HerzegovinaBotswanaBrazilBrunei DarussalamBulgariaBurkina FasoBurundiCabo VerdeCambodiaCameroonCanadaCayman IslandsCentral African RepublicChadChileChinaColombiaComorosCongo, Dem. Rep.Congo, Rep.Costa RicaCote d'IvoireCroatiaCubaCyprusCzech RepublicDenmarkDjiboutiDominicaDominican RepublicEcuadorEgypt, Arab Rep.El SalvadorEquatorial GuineaEritreaEstoniaEthiopiaFaroe IslandsFijiFinlandFranceFrench PolynesiaGabonGambia, TheGeorgiaGermanyGhanaGibraltarGreeceGreenlandGrenadaGuatemalaGuineaGuinea-BissauGuyanaHaitiHondurasHong Kong SAR, ChinaHungaryIcelandIndiaIndonesiaIran, Islamic Rep.IraqIrelandIsraelItalyJamaicaJapanJordanKazakhstanKenyaKiribatiKorea, Dem. People’s Rep.Korea, Rep.KuwaitKyrgyz RepublicLao PDRLatviaLebanonLesothoLiberiaLibyaLiechtensteinLithuaniaLuxembourgMacao SAR, ChinaMacedonia, FYRMadagascarMalawiMalaysiaMaldivesMaliMaltaMarshall IslandsMauritaniaMauritiusMexicoMicronesia, Fed. Sts.MoldovaMongoliaMontenegroMoroccoMozambiqueMyanmarNamibiaNepalNetherlandsNew CaledoniaNew ZealandNicaraguaNigerNigeriaNorwayOmanPakistanPalauPanamaPapua New GuineaParaguayPeruPhilippinesPolandPortugalQatarRomaniaRussian FederationRwandaSamoaSao Tome and PrincipeSaudi ArabiaSenegalSerbiaSeychellesSierra LeoneSingaporeSlovak RepublicSloveniaSolomon IslandsSomaliaSouth AfricaSpainSri LankaSt. Kitts and NevisSt. LuciaSt. Vincent and the GrenadinesSudanSurinameSwazilandSwedenSwitzerlandSyrian Arab RepublicTajikistanTanzaniaThailandTimor-LesteTogoTongaTrinidad and TobagoTunisiaTurkeyTurkmenistanTurks and Caicos IslandsUgandaUkraineUnited Arab EmiratesUnited KingdomUnited StatesUruguayUzbekistanVanuatuVenezuela, RBVietnamWest Bank and GazaYemen, Rep.ZambiaZimbabwe Timeline:
This timeline shows a graph from 1971 to 2015 of Finland. No data until 1970. Number of actual observations by date: 45.
Source name:
World Development Indicators
Source organization:
World Bank staff estimates based on Samuel Fankhauser's "Valuing Climate Change: The Economics of the Greenhouse" (1995).
Categories, topics:
Economy & Growth, Environment
Last updated:
apr 23, 2017
Indicators value changes by year
Minimum:
53.92 mln
jan 1, 1971
Maximum:
581.206 mln
jan 1, 2011
At the date of observation
Value
Absolute change
Change from previous value
jan 1, 1971
53.92 mln
+53.92 mln
0.0%
jan 1, 1972
57.589 mln
+3.669 mln
6.8%
jan 1, 1973
66.149 mln
+8.56 mln
14.86%
jan 1, 1974
78.919 mln
+12.77 mln
19.3%
jan 1, 1975
82.25 mln
+3.332 mln
4.22%
jan 1, 1976
89.795 mln
+7.545 mln
9.17%
jan 1, 1977
106.601 mln
+16.806 mln
18.72%
jan 1, 1978
112.176 mln
+5.575 mln
5.23%
jan 1, 1979
125.561 mln
+13.384 mln
11.93%
jan 1, 1980
143.936 mln
+18.375 mln
14.63%
jan 1, 1981
170.193 mln
+26.258 mln
18.24%
jan 1, 1982
166.496 mln
-3.698 mln
-2.17%
jan 1, 1983
149.635 mln
-16.861 mln
-10.13%
jan 1, 1984
151.866 mln
+2.231 mln
1.49%
jan 1, 1985
161.698 mln
+9.832 mln
6.47%
jan 1, 1986
198.444 mln
+36.746 mln
22.72%
jan 1, 1987
219.935 mln
+21.491 mln
10.83%
jan 1, 1988
246.712 mln
+26.777 mln
12.17%
jan 1, 1989
233.834 mln
-12.878 mln
-5.22%
jan 1, 1990
247.662 mln
+13.828 mln
5.91%
jan 1, 1991
255.692 mln
+8.03 mln
3.24%
jan 1, 1992
277.404 mln
+21.712 mln
8.49%
jan 1, 1993
253.776 mln
-23.628 mln
-8.52%
jan 1, 1994
279.091 mln
+25.315 mln
9.98%
jan 1, 1995
327.404 mln
+48.313 mln
17.31%
jan 1, 1996
311.506 mln
-15.898 mln
-4.86%
jan 1, 1997
373.092 mln
+61.587 mln
19.77%
jan 1, 1998
375.482 mln
+2.39 mln
0.64%
jan 1, 1999
365.15 mln
-10.333 mln
-2.75%
jan 1, 2000
364.789 mln
-360.465K
-0.1%
jan 1, 2001
357.07 mln
-7.719 mln
-2.12%
jan 1, 2002
402.086 mln
+45.015 mln
12.61%
jan 1, 2003
446.59 mln
+44.505 mln
11.07%
jan 1, 2004
516.493 mln
+69.903 mln
15.65%
jan 1, 2005
521.091 mln
+4.598 mln
0.89%
jan 1, 2006
442.93 mln
-78.161 mln
-15.0%
jan 1, 2007
558.887 mln
+115.957 mln
26.18%
jan 1, 2008
560.392 mln
+1.506 mln
0.27%
jan 1, 2009
510.717 mln
-49.675 mln
-8.86%
jan 1, 2010
488.504 mln
-22.213 mln
-4.35%
jan 1, 2011
581.206 mln
+92.702 mln
18.98%
jan 1, 2012
530.845 mln
-50.361 mln
-8.66%
jan 1, 2013
538.272 mln
+7.427 mln
1.4%
jan 1, 2014
545.844 mln
+7.572 mln
1.41%
jan 1, 2015
557.367 mln
+11.522 mln
2.11%
Ranking of countries by current statistics by years


Comments: