29
/
en
AIzaSyAYiBZKx7MnpbEhh9jyipgxe19OcubqV5w
April 1, 2024
227120
Qatar
QAT
true
2
1
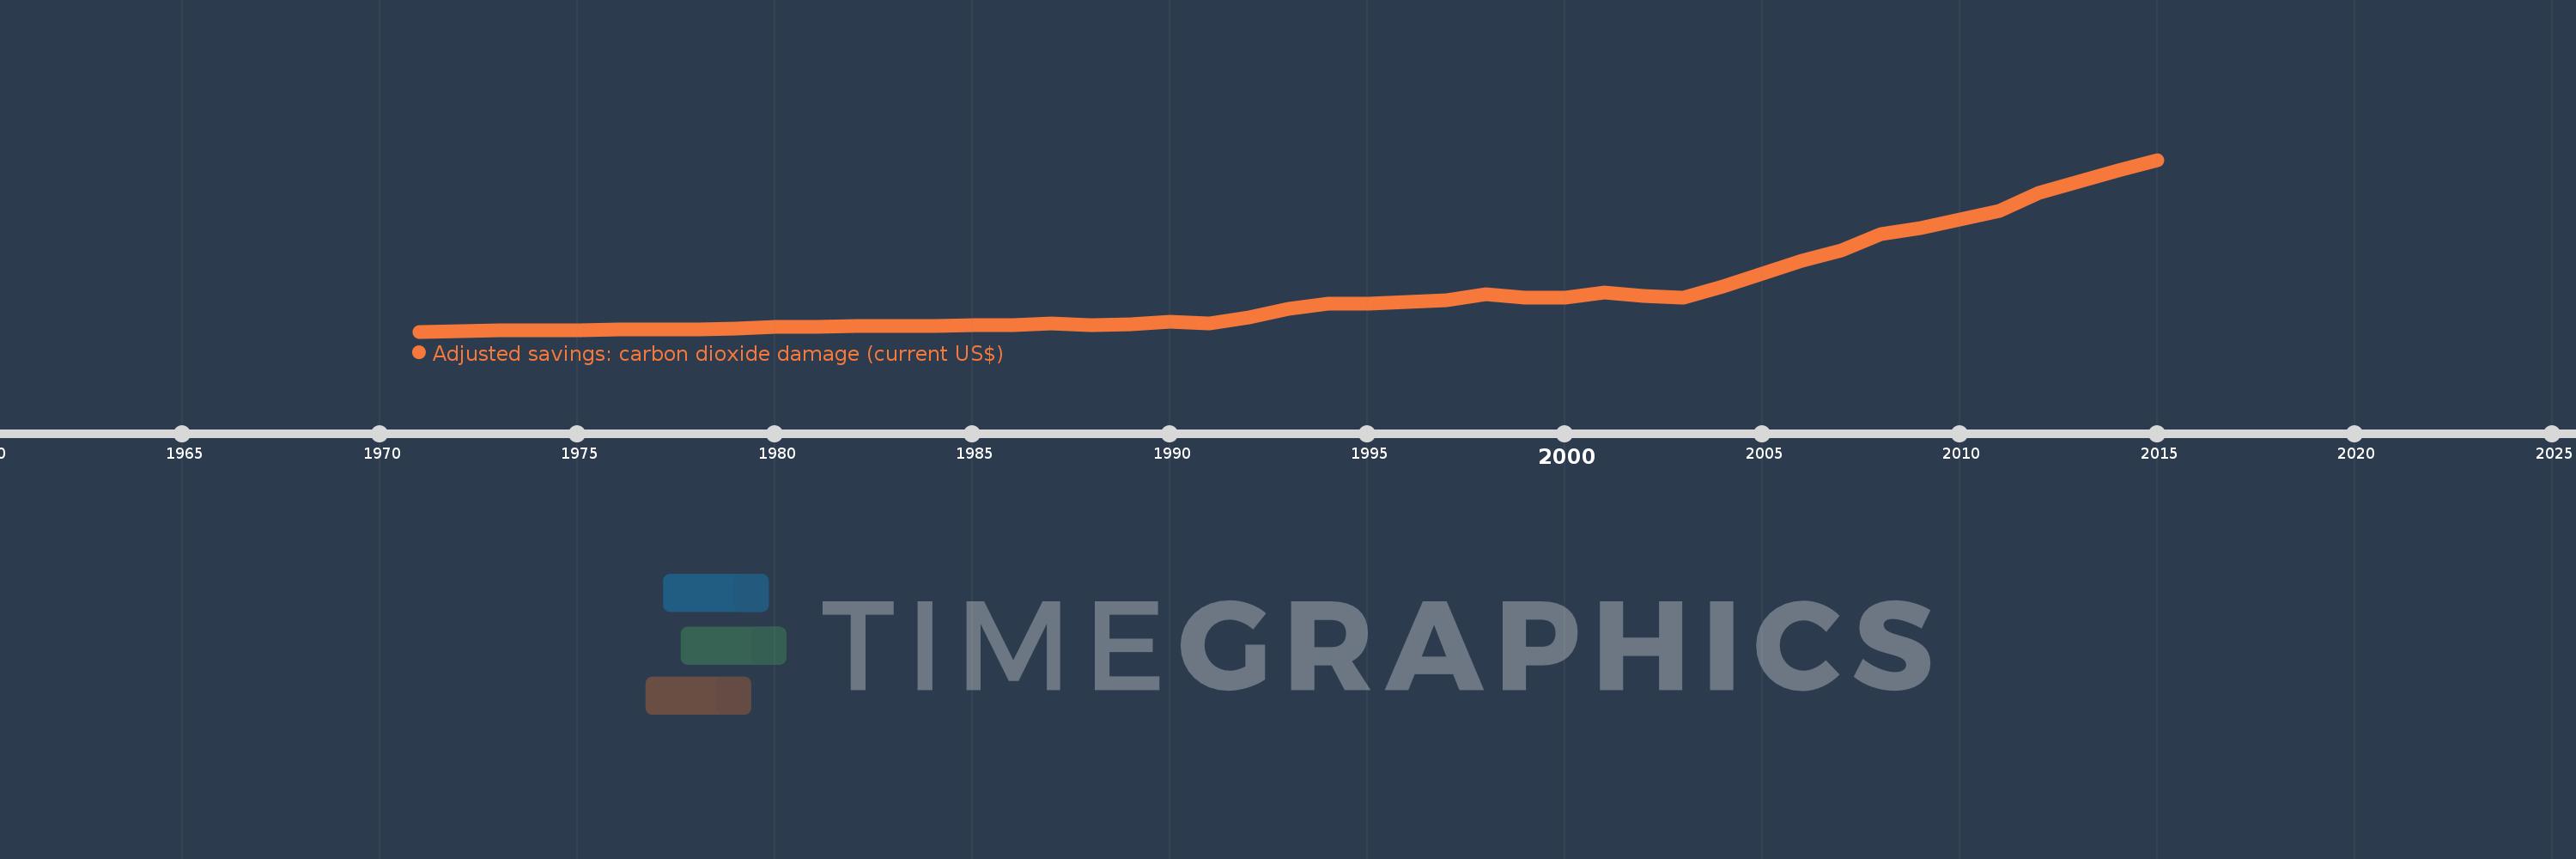
Adjusted savings: carbon dioxide damage (current US$)
2015,2014,2013,2012,2011,2010,2009,2008,2007,2006,2005,2004,2003,2002,2001,2000,1999,1998,1997,1996,1995,1994,1993,1992,1991,1990,1989,1988,1987,1986,1985,1984,1983,1982,1981,1980,1979,1978,1977,1976,1975,1974,1973,1972,1971
This statistics in other country:
AfghanistanAlbaniaAlgeriaAndorraAngolaAntigua and BarbudaArgentinaArmeniaArubaAustraliaAustriaAzerbaijanBahamas, TheBahrainBangladeshBarbadosBelarusBelgiumBelizeBeninBermudaBhutanBoliviaBosnia and HerzegovinaBotswanaBrazilBrunei DarussalamBulgariaBurkina FasoBurundiCabo VerdeCambodiaCameroonCanadaCayman IslandsCentral African RepublicChadChileChinaColombiaComorosCongo, Dem. Rep.Congo, Rep.Costa RicaCote d'IvoireCroatiaCubaCyprusCzech RepublicDenmarkDjiboutiDominicaDominican RepublicEcuadorEgypt, Arab Rep.El SalvadorEquatorial GuineaEritreaEstoniaEthiopiaFaroe IslandsFijiFinlandFranceFrench PolynesiaGabonGambia, TheGeorgiaGermanyGhanaGibraltarGreeceGreenlandGrenadaGuatemalaGuineaGuinea-BissauGuyanaHaitiHondurasHong Kong SAR, ChinaHungaryIcelandIndiaIndonesiaIran, Islamic Rep.IraqIrelandIsraelItalyJamaicaJapanJordanKazakhstanKenyaKiribatiKorea, Dem. People’s Rep.Korea, Rep.KuwaitKyrgyz RepublicLao PDRLatviaLebanonLesothoLiberiaLibyaLiechtensteinLithuaniaLuxembourgMacao SAR, ChinaMacedonia, FYRMadagascarMalawiMalaysiaMaldivesMaliMaltaMarshall IslandsMauritaniaMauritiusMexicoMicronesia, Fed. Sts.MoldovaMongoliaMontenegroMoroccoMozambiqueMyanmarNamibiaNepalNetherlandsNew CaledoniaNew ZealandNicaraguaNigerNigeriaNorwayOmanPakistanPalauPanamaPapua New GuineaParaguayPeruPhilippinesPolandPortugalQatarRomaniaRussian FederationRwandaSamoaSao Tome and PrincipeSaudi ArabiaSenegalSerbiaSeychellesSierra LeoneSingaporeSlovak RepublicSloveniaSolomon IslandsSomaliaSouth AfricaSpainSri LankaSt. Kitts and NevisSt. LuciaSt. Vincent and the GrenadinesSudanSurinameSwazilandSwedenSwitzerlandSyrian Arab RepublicTajikistanTanzaniaThailandTimor-LesteTogoTongaTrinidad and TobagoTunisiaTurkeyTurkmenistanTurks and Caicos IslandsUgandaUkraineUnited Arab EmiratesUnited KingdomUnited StatesUruguayUzbekistanVanuatuVenezuela, RBVietnamWest Bank and GazaYemen, Rep.ZambiaZimbabwe Timeline:
This timeline shows a graph from 1971 to 2015 of Qatar. No data until 1970. Number of actual observations by date: 45.
Source name:
World Development Indicators
Source organization:
World Bank staff estimates based on Samuel Fankhauser's "Valuing Climate Change: The Economics of the Greenhouse" (1995).
Categories, topics:
Economy & Growth, Environment
Last updated:
apr 23, 2017
Indicators value changes by year
Minimum:
10.103 mln
jan 1, 1971
Maximum:
1.003 bln
jan 1, 2015
At the date of observation
Value
Absolute change
Change from previous value
jan 1, 1971
10.103 mln
+10.103 mln
0.0%
jan 1, 1972
12.988 mln
+2.886 mln
28.56%
jan 1, 1973
16.154 mln
+3.166 mln
24.37%
jan 1, 1974
19.923 mln
+3.769 mln
23.33%
jan 1, 1975
18.479 mln
-1.444 mln
-7.25%
jan 1, 1976
21.342 mln
+2.863 mln
15.49%
jan 1, 1977
21.589 mln
+246.848K
1.16%
jan 1, 1978
22.173 mln
+584.614K
2.71%
jan 1, 1979
25.472 mln
+3.299 mln
14.88%
jan 1, 1980
38.041 mln
+12.569 mln
49.34%
jan 1, 1981
38.273 mln
+232.289K
0.61%
jan 1, 1982
41.568 mln
+3.294 mln
8.61%
jan 1, 1983
42.908 mln
+1.34 mln
3.22%
jan 1, 1984
41.161 mln
-1.747 mln
-4.07%
jan 1, 1985
47.192 mln
+6.031 mln
14.65%
jan 1, 1986
49.567 mln
+2.375 mln
5.03%
jan 1, 1987
54.836 mln
+5.269 mln
10.63%
jan 1, 1988
49.207 mln
-5.629 mln
-10.26%
jan 1, 1989
53.451 mln
+4.244 mln
8.62%
jan 1, 1990
67.477 mln
+14.026 mln
26.24%
jan 1, 1991
58.184 mln
-9.293 mln
-13.77%
jan 1, 1992
91.306 mln
+33.123 mln
56.93%
jan 1, 1993
143.276 mln
+51.97 mln
56.92%
jan 1, 1994
170.115 mln
+26.839 mln
18.73%
jan 1, 1995
172.923 mln
+2.808 mln
1.65%
jan 1, 1996
182.158 mln
+9.235 mln
5.34%
jan 1, 1997
193.757 mln
+11.599 mln
6.37%
jan 1, 1998
227.348 mln
+33.591 mln
17.34%
jan 1, 1999
207.61 mln
-19.738 mln
-8.68%
jan 1, 2000
206.724 mln
-886.172K
-0.43%
jan 1, 2001
236.54 mln
+29.816 mln
14.42%
jan 1, 2002
213.991 mln
-22.549 mln
-9.53%
jan 1, 2003
206.21 mln
-7.78 mln
-3.64%
jan 1, 2004
270.137 mln
+63.926 mln
31.0%
jan 1, 2005
344.793 mln
+74.656 mln
27.64%
jan 1, 2006
420.519 mln
+75.726 mln
21.96%
jan 1, 2007
478.984 mln
+58.465 mln
13.9%
jan 1, 2008
571.376 mln
+92.392 mln
19.29%
jan 1, 2009
609.161 mln
+37.785 mln
6.61%
jan 1, 2010
655.483 mln
+46.322 mln
7.6%
jan 1, 2011
707.476 mln
+51.993 mln
7.93%
jan 1, 2012
812.99 mln
+105.515 mln
14.91%
jan 1, 2013
877.101 mln
+64.111 mln
7.89%
jan 1, 2014
940.736 mln
+63.636 mln
7.26%
jan 1, 2015
1.003 bln
+62.133 mln
6.6%
Ranking of countries by current statistics by years


Comments: