29
/
en
AIzaSyAYiBZKx7MnpbEhh9jyipgxe19OcubqV5w
April 1, 2024
136348
Gambia, The
GMB
true
2
1
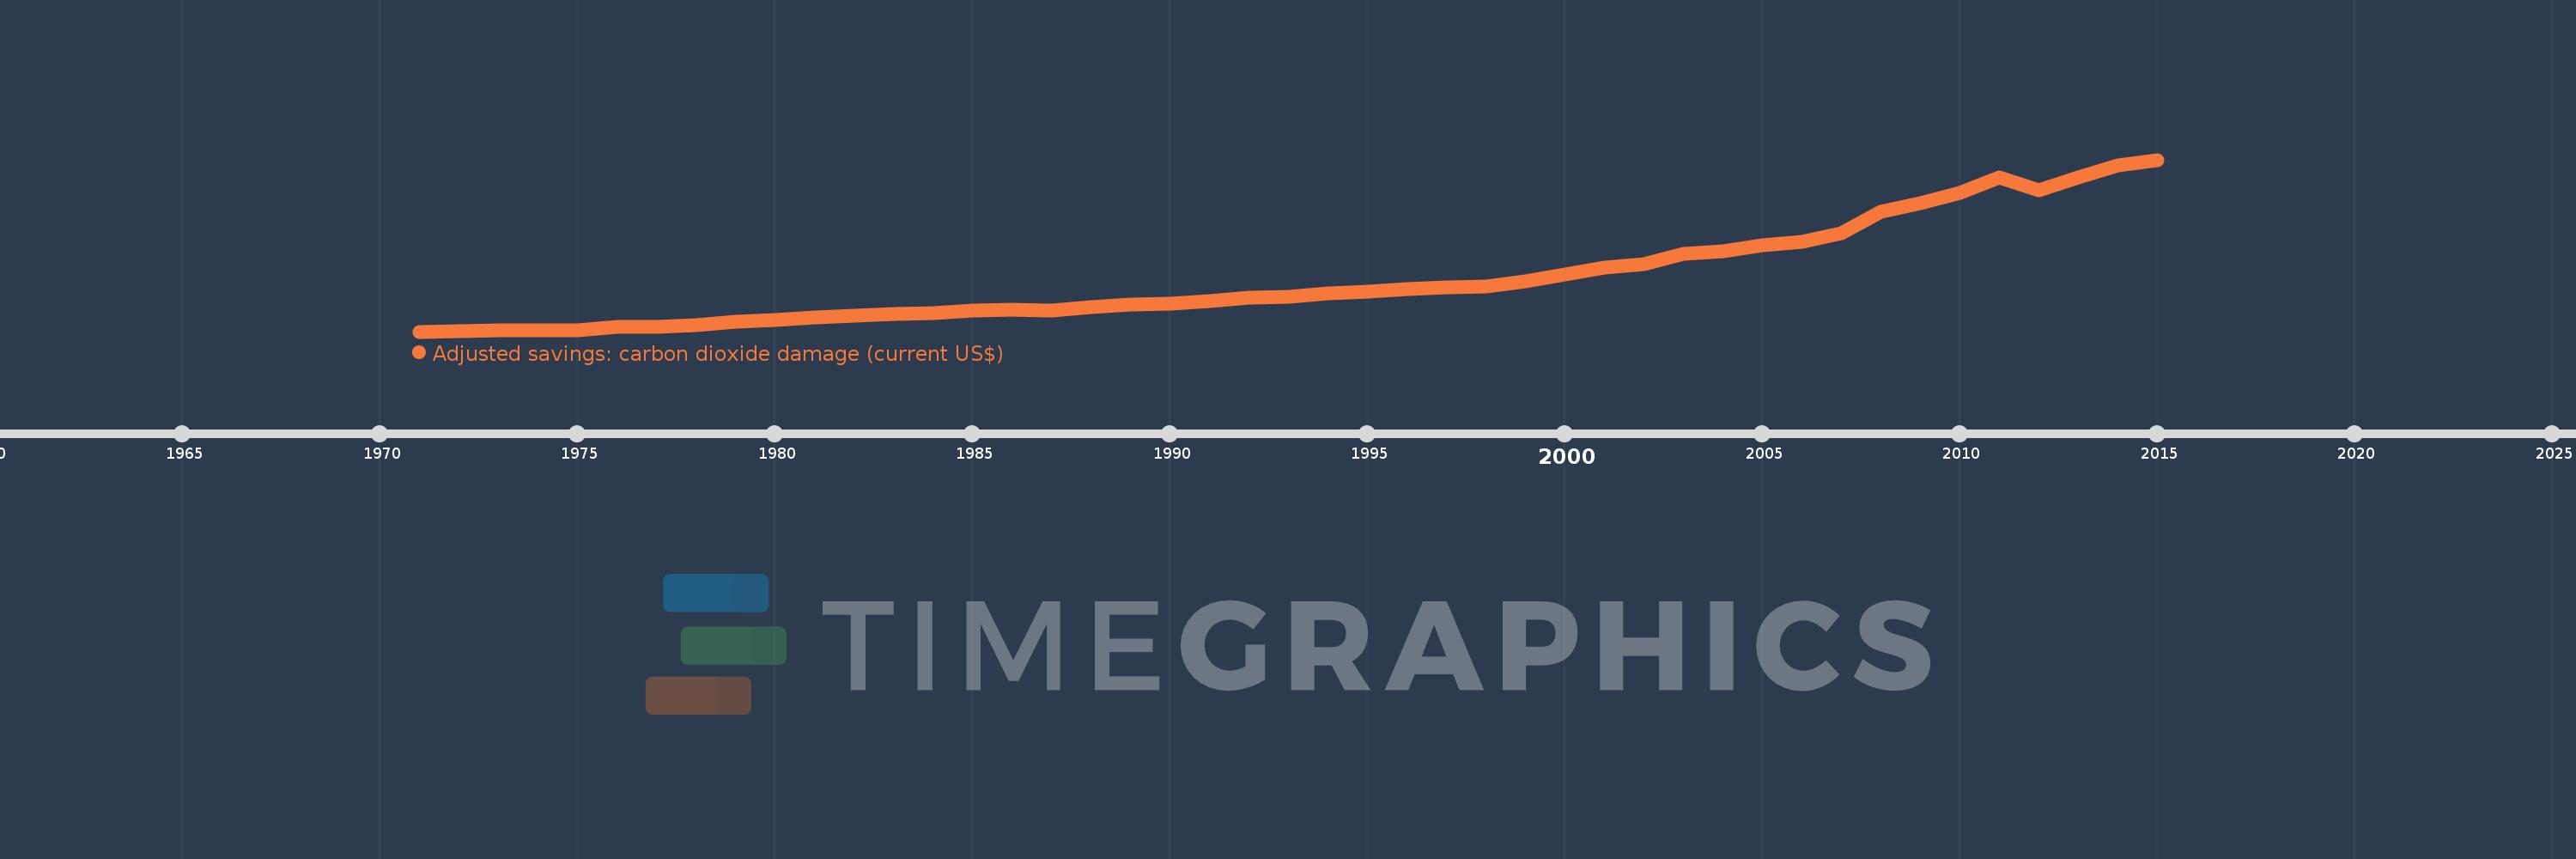
Adjusted savings: carbon dioxide damage (current US$)
2015,2014,2013,2012,2011,2010,2009,2008,2007,2006,2005,2004,2003,2002,2001,2000,1999,1998,1997,1996,1995,1994,1993,1992,1991,1990,1989,1988,1987,1986,1985,1984,1983,1982,1981,1980,1979,1978,1977,1976,1975,1974,1973,1972,1971
This statistics in other country:
AfghanistanAlbaniaAlgeriaAndorraAngolaAntigua and BarbudaArgentinaArmeniaArubaAustraliaAustriaAzerbaijanBahamas, TheBahrainBangladeshBarbadosBelarusBelgiumBelizeBeninBermudaBhutanBoliviaBosnia and HerzegovinaBotswanaBrazilBrunei DarussalamBulgariaBurkina FasoBurundiCabo VerdeCambodiaCameroonCanadaCayman IslandsCentral African RepublicChadChileChinaColombiaComorosCongo, Dem. Rep.Congo, Rep.Costa RicaCote d'IvoireCroatiaCubaCyprusCzech RepublicDenmarkDjiboutiDominicaDominican RepublicEcuadorEgypt, Arab Rep.El SalvadorEquatorial GuineaEritreaEstoniaEthiopiaFaroe IslandsFijiFinlandFranceFrench PolynesiaGabonGambia, TheGeorgiaGermanyGhanaGibraltarGreeceGreenlandGrenadaGuatemalaGuineaGuinea-BissauGuyanaHaitiHondurasHong Kong SAR, ChinaHungaryIcelandIndiaIndonesiaIran, Islamic Rep.IraqIrelandIsraelItalyJamaicaJapanJordanKazakhstanKenyaKiribatiKorea, Dem. People’s Rep.Korea, Rep.KuwaitKyrgyz RepublicLao PDRLatviaLebanonLesothoLiberiaLibyaLiechtensteinLithuaniaLuxembourgMacao SAR, ChinaMacedonia, FYRMadagascarMalawiMalaysiaMaldivesMaliMaltaMarshall IslandsMauritaniaMauritiusMexicoMicronesia, Fed. Sts.MoldovaMongoliaMontenegroMoroccoMozambiqueMyanmarNamibiaNepalNetherlandsNew CaledoniaNew ZealandNicaraguaNigerNigeriaNorwayOmanPakistanPalauPanamaPapua New GuineaParaguayPeruPhilippinesPolandPortugalQatarRomaniaRussian FederationRwandaSamoaSao Tome and PrincipeSaudi ArabiaSenegalSerbiaSeychellesSierra LeoneSingaporeSlovak RepublicSloveniaSolomon IslandsSomaliaSouth AfricaSpainSri LankaSt. Kitts and NevisSt. LuciaSt. Vincent and the GrenadinesSudanSurinameSwazilandSwedenSwitzerlandSyrian Arab RepublicTajikistanTanzaniaThailandTimor-LesteTogoTongaTrinidad and TobagoTunisiaTurkeyTurkmenistanTurks and Caicos IslandsUgandaUkraineUnited Arab EmiratesUnited KingdomUnited StatesUruguayUzbekistanVanuatuVenezuela, RBVietnamWest Bank and GazaYemen, Rep.ZambiaZimbabwe Timeline:
This timeline shows a graph from 1971 to 2015 of Gambia, The. No data until 1970. Number of actual observations by date: 45.
Source name:
World Development Indicators
Source organization:
World Bank staff estimates based on Samuel Fankhauser's "Valuing Climate Change: The Economics of the Greenhouse" (1995).
Categories, topics:
Economy & Growth, Environment
Last updated:
apr 23, 2017
Indicators value changes by year
Minimum:
63.631K
jan 1, 1971
Maximum:
4.947 mln
jan 1, 2015
At the date of observation
Value
Absolute change
Change from previous value
jan 1, 1971
63.631K
+63.631K
0.0%
jan 1, 1972
78.055K
+14.424K
22.67%
jan 1, 1973
98.869K
+20.814K
26.67%
jan 1, 1974
99.615K
+745.824
0.75%
jan 1, 1975
109.84K
+10.224K
10.26%
jan 1, 1976
192.847K
+83.007K
75.57%
jan 1, 1977
205.823K
+12.976K
6.73%
jan 1, 1978
253.923K
+48.099K
23.37%
jan 1, 1979
337.029K
+83.106K
32.73%
jan 1, 1980
388.569K
+51.54K
15.29%
jan 1, 1981
460.735K
+72.166K
18.57%
jan 1, 1982
509.669K
+48.934K
10.62%
jan 1, 1983
560.384K
+50.714K
9.95%
jan 1, 1984
589.354K
+28.971K
5.17%
jan 1, 1985
659.534K
+70.18K
11.91%
jan 1, 1986
688.634K
+29.1K
4.41%
jan 1, 1987
665.416K
-23.219K
-3.37%
jan 1, 1988
768.866K
+103.45K
15.55%
jan 1, 1989
821.566K
+52.7K
6.85%
jan 1, 1990
846.266K
+24.7K
3.01%
jan 1, 1991
942.243K
+95.977K
11.34%
jan 1, 1992
1.023 mln
+80.688K
8.56%
jan 1, 1993
1.059 mln
+35.613K
3.48%
jan 1, 1994
1.157 mln
+98.836K
9.34%
jan 1, 1995
1.196 mln
+38.519K
3.33%
jan 1, 1996
1.279 mln
+82.628K
6.91%
jan 1, 1997
1.317 mln
+38.637K
3.02%
jan 1, 1998
1.355 mln
+38.284K
2.91%
jan 1, 1999
1.504 mln
+148.289K
10.94%
jan 1, 2000
1.69 mln
+185.772K
12.35%
jan 1, 2001
1.873 mln
+183.629K
10.87%
jan 1, 2002
1.99 mln
+116.872K
6.24%
jan 1, 2003
2.283 mln
+293.252K
14.74%
jan 1, 2004
2.356 mln
+72.901K
3.19%
jan 1, 2005
2.506 mln
+150.176K
6.37%
jan 1, 2006
2.616 mln
+109.272K
4.36%
jan 1, 2007
2.848 mln
+232.534K
8.89%
jan 1, 2008
3.469 mln
+620.384K
21.78%
jan 1, 2009
3.706 mln
+237.595K
6.85%
jan 1, 2010
4.009 mln
+303.253K
8.18%
jan 1, 2011
4.446 mln
+436.252K
10.88%
jan 1, 2012
4.088 mln
-358.109K
-8.06%
jan 1, 2013
4.451 mln
+363.632K
8.9%
jan 1, 2014
4.783 mln
+332.053K
7.46%
jan 1, 2015
4.947 mln
+163.837K
3.43%
Ranking of countries by current statistics by years


Comments: