29
/
en
AIzaSyAYiBZKx7MnpbEhh9jyipgxe19OcubqV5w
April 1, 2024
197097
Moldova
MDA
true
2
1
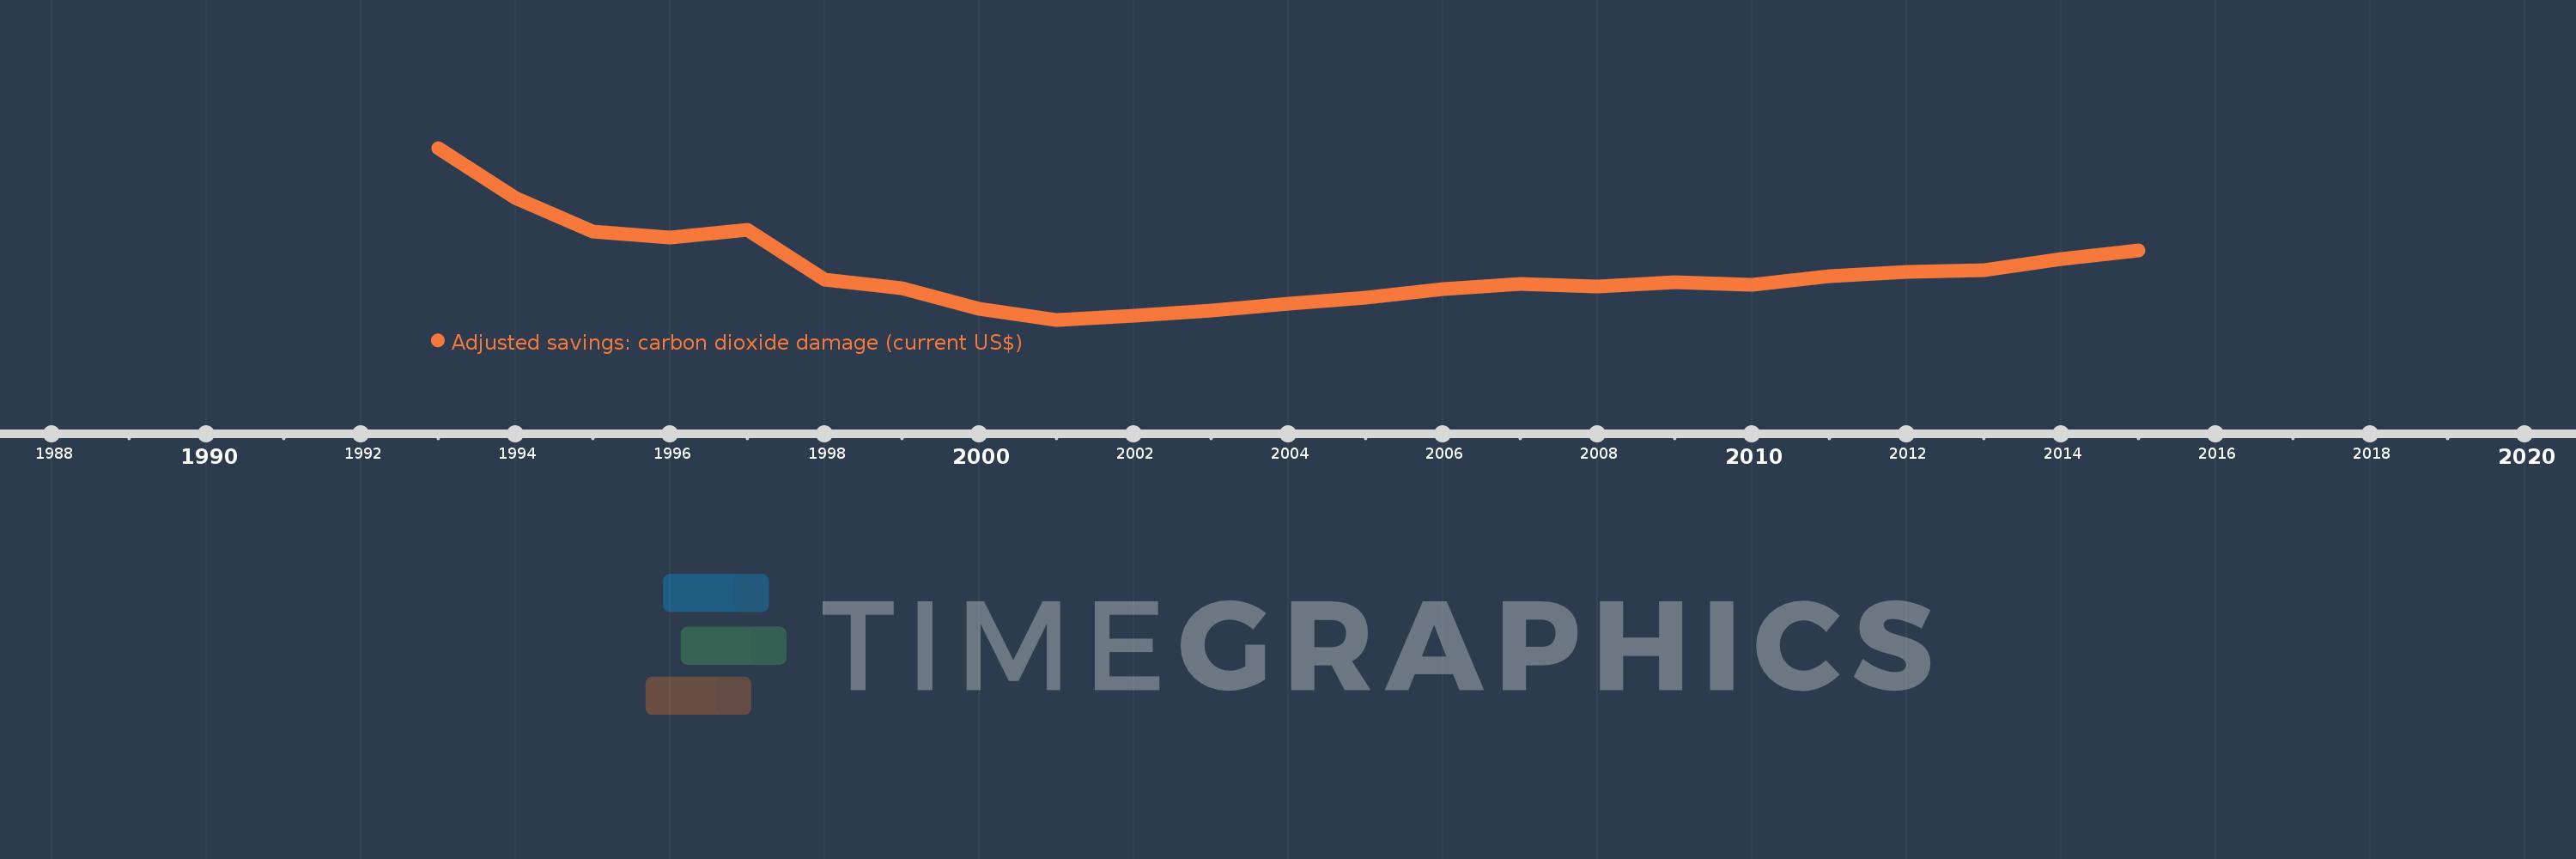
Adjusted savings: carbon dioxide damage (current US$)
2015,2014,2013,2012,2011,2010,2009,2008,2007,2006,2005,2004,2003,2002,2001,2000,1999,1998,1997,1996,1995,1994,1993
This statistics in other country:
AfghanistanAlbaniaAlgeriaAndorraAngolaAntigua and BarbudaArgentinaArmeniaArubaAustraliaAustriaAzerbaijanBahamas, TheBahrainBangladeshBarbadosBelarusBelgiumBelizeBeninBermudaBhutanBoliviaBosnia and HerzegovinaBotswanaBrazilBrunei DarussalamBulgariaBurkina FasoBurundiCabo VerdeCambodiaCameroonCanadaCayman IslandsCentral African RepublicChadChileChinaColombiaComorosCongo, Dem. Rep.Congo, Rep.Costa RicaCote d'IvoireCroatiaCubaCyprusCzech RepublicDenmarkDjiboutiDominicaDominican RepublicEcuadorEgypt, Arab Rep.El SalvadorEquatorial GuineaEritreaEstoniaEthiopiaFaroe IslandsFijiFinlandFranceFrench PolynesiaGabonGambia, TheGeorgiaGermanyGhanaGibraltarGreeceGreenlandGrenadaGuatemalaGuineaGuinea-BissauGuyanaHaitiHondurasHong Kong SAR, ChinaHungaryIcelandIndiaIndonesiaIran, Islamic Rep.IraqIrelandIsraelItalyJamaicaJapanJordanKazakhstanKenyaKiribatiKorea, Dem. People’s Rep.Korea, Rep.KuwaitKyrgyz RepublicLao PDRLatviaLebanonLesothoLiberiaLibyaLiechtensteinLithuaniaLuxembourgMacao SAR, ChinaMacedonia, FYRMadagascarMalawiMalaysiaMaldivesMaliMaltaMarshall IslandsMauritaniaMauritiusMexicoMicronesia, Fed. Sts.MoldovaMongoliaMontenegroMoroccoMozambiqueMyanmarNamibiaNepalNetherlandsNew CaledoniaNew ZealandNicaraguaNigerNigeriaNorwayOmanPakistanPalauPanamaPapua New GuineaParaguayPeruPhilippinesPolandPortugalQatarRomaniaRussian FederationRwandaSamoaSao Tome and PrincipeSaudi ArabiaSenegalSerbiaSeychellesSierra LeoneSingaporeSlovak RepublicSloveniaSolomon IslandsSomaliaSouth AfricaSpainSri LankaSt. Kitts and NevisSt. LuciaSt. Vincent and the GrenadinesSudanSurinameSwazilandSwedenSwitzerlandSyrian Arab RepublicTajikistanTanzaniaThailandTimor-LesteTogoTongaTrinidad and TobagoTunisiaTurkeyTurkmenistanTurks and Caicos IslandsUgandaUkraineUnited Arab EmiratesUnited KingdomUnited StatesUruguayUzbekistanVanuatuVenezuela, RBVietnamWest Bank and GazaYemen, Rep.ZambiaZimbabwe Timeline:
This timeline shows a graph from 1993 to 2015 of Moldova. No data until 1992. Number of actual observations by date: 23.
Source name:
World Development Indicators
Source organization:
World Bank staff estimates based on Samuel Fankhauser's "Valuing Climate Change: The Economics of the Greenhouse" (1995).
Categories, topics:
Economy & Growth, Environment
Last updated:
apr 23, 2017
Indicators value changes by year
Minimum:
23.926 mln
jan 1, 2001
Maximum:
112.108 mln
jan 1, 1993
At the date of observation
Value
Absolute change
Change from previous value
jan 1, 1993
112.108 mln
+112.108 mln
0.0%
jan 1, 1994
86.54 mln
-25.568 mln
-22.81%
jan 1, 1995
69.173 mln
-17.366 mln
-20.07%
jan 1, 1996
66.137 mln
-3.037 mln
-4.39%
jan 1, 1997
70.145 mln
+4.008 mln
6.06%
jan 1, 1998
44.477 mln
-25.667 mln
-36.59%
jan 1, 1999
40.178 mln
-4.299 mln
-9.67%
jan 1, 2000
29.639 mln
-10.539 mln
-26.23%
jan 1, 2001
23.926 mln
-5.713 mln
-19.27%
jan 1, 2002
26.18 mln
+2.254 mln
9.42%
jan 1, 2003
28.859 mln
+2.679 mln
10.23%
jan 1, 2004
32.055 mln
+3.195 mln
11.07%
jan 1, 2005
35.374 mln
+3.319 mln
10.35%
jan 1, 2006
39.68 mln
+4.306 mln
12.17%
jan 1, 2007
42.165 mln
+2.485 mln
6.26%
jan 1, 2008
40.98 mln
-1.185 mln
-2.81%
jan 1, 2009
43.084 mln
+2.104 mln
5.13%
jan 1, 2010
41.812 mln
-1.272 mln
-2.95%
jan 1, 2011
46.386 mln
+4.574 mln
10.94%
jan 1, 2012
48.268 mln
+1.882 mln
4.06%
jan 1, 2013
49.304 mln
+1.036 mln
2.15%
jan 1, 2014
55.316 mln
+6.012 mln
12.19%
jan 1, 2015
59.322 mln
+4.006 mln
7.24%
Ranking of countries by current statistics by years


Comments: