30
/
AIzaSyAYiBZKx7MnpbEhh9jyipgxe19OcubqV5w
April 1, 2024
199599
Mongolia
MNG
true
2
1
Over-age students, primary (% of enrollment)
2015,2014,1998,1997,1996,1984,1981
Public Timelines
FAQ
Menu
Public Timelines
FAQ
Public Timelines
FAQ
For education
For educational institutions
For teachers
For students
Open cabinet
For educational institutions
For teachers
For students
Open cabinet
Create
Close
Create a timeline
Public timelines
Library
FAQ
Download
Global statistics library
→
Mongolia
→
Over-age students, primary (% of enrollment)
This statistics in other country:
Afghanistan
Albania
Algeria
Andorra
Angola
Antigua and Barbuda
Argentina
Aruba
Australia
Austria
Azerbaijan
Bahamas, The
Bahrain
Bangladesh
Barbados
Belarus
Belgium
Belize
Benin
Bermuda
Bhutan
Bolivia
Bosnia and Herzegovina
Botswana
Brazil
British Virgin Islands
Brunei Darussalam
Bulgaria
Burkina Faso
Burundi
Cabo Verde
Cambodia
Cameroon
Canada
Central African Republic
Chad
Chile
China
Colombia
Comoros
Congo, Dem. Rep.
Congo, Rep.
Costa Rica
Cote d'Ivoire
Cuba
Cyprus
Denmark
Djibouti
Dominica
Dominican Republic
Ecuador
Egypt, Arab Rep.
El Salvador
Equatorial Guinea
Eritrea
Estonia
Ethiopia
Fiji
Finland
France
Gabon
Gambia, The
Georgia
Germany
Ghana
Greece
Grenada
Guatemala
Guinea
Guinea-Bissau
Guyana
Haiti
Honduras
Hong Kong SAR, China
Hungary
Iceland
India
Indonesia
Iran, Islamic Rep.
Iraq
Ireland
Italy
Jamaica
Japan
Jordan
Kazakhstan
Kenya
Kiribati
Korea, Dem. People’s Rep.
Korea, Rep.
Kuwait
Kyrgyz Republic
Lao PDR
Lebanon
Lesotho
Libya
Luxembourg
Macao SAR, China
Madagascar
Malawi
Malaysia
Maldives
Mali
Malta
Marshall Islands
Mauritania
Mauritius
Mexico
Moldova
Mongolia
Montenegro
Morocco
Mozambique
Myanmar
Namibia
Nepal
Netherlands
New Zealand
Nicaragua
Niger
Norway
Oman
Pakistan
Palau
Panama
Paraguay
Peru
Philippines
Poland
Portugal
Puerto Rico
Qatar
Russian Federation
Rwanda
Samoa
San Marino
Sao Tome and Principe
Saudi Arabia
Senegal
Serbia
Seychelles
Sierra Leone
Singapore
Sint Maarten (Dutch part)
Slovenia
Solomon Islands
Somalia
South Africa
South Sudan
Spain
Sri Lanka
St. Kitts and Nevis
St. Lucia
St. Vincent and the Grenadines
Suriname
Swaziland
Sweden
Switzerland
Syrian Arab Republic
Tajikistan
Tanzania
Thailand
Timor-Leste
Togo
Tonga
Trinidad and Tobago
Tunisia
Turkey
Turks and Caicos Islands
Tuvalu
Uganda
Ukraine
United Arab Emirates
United Kingdom
United States
Uruguay
Vanuatu
Venezuela, RB
Vietnam
Zambia
Zimbabwe
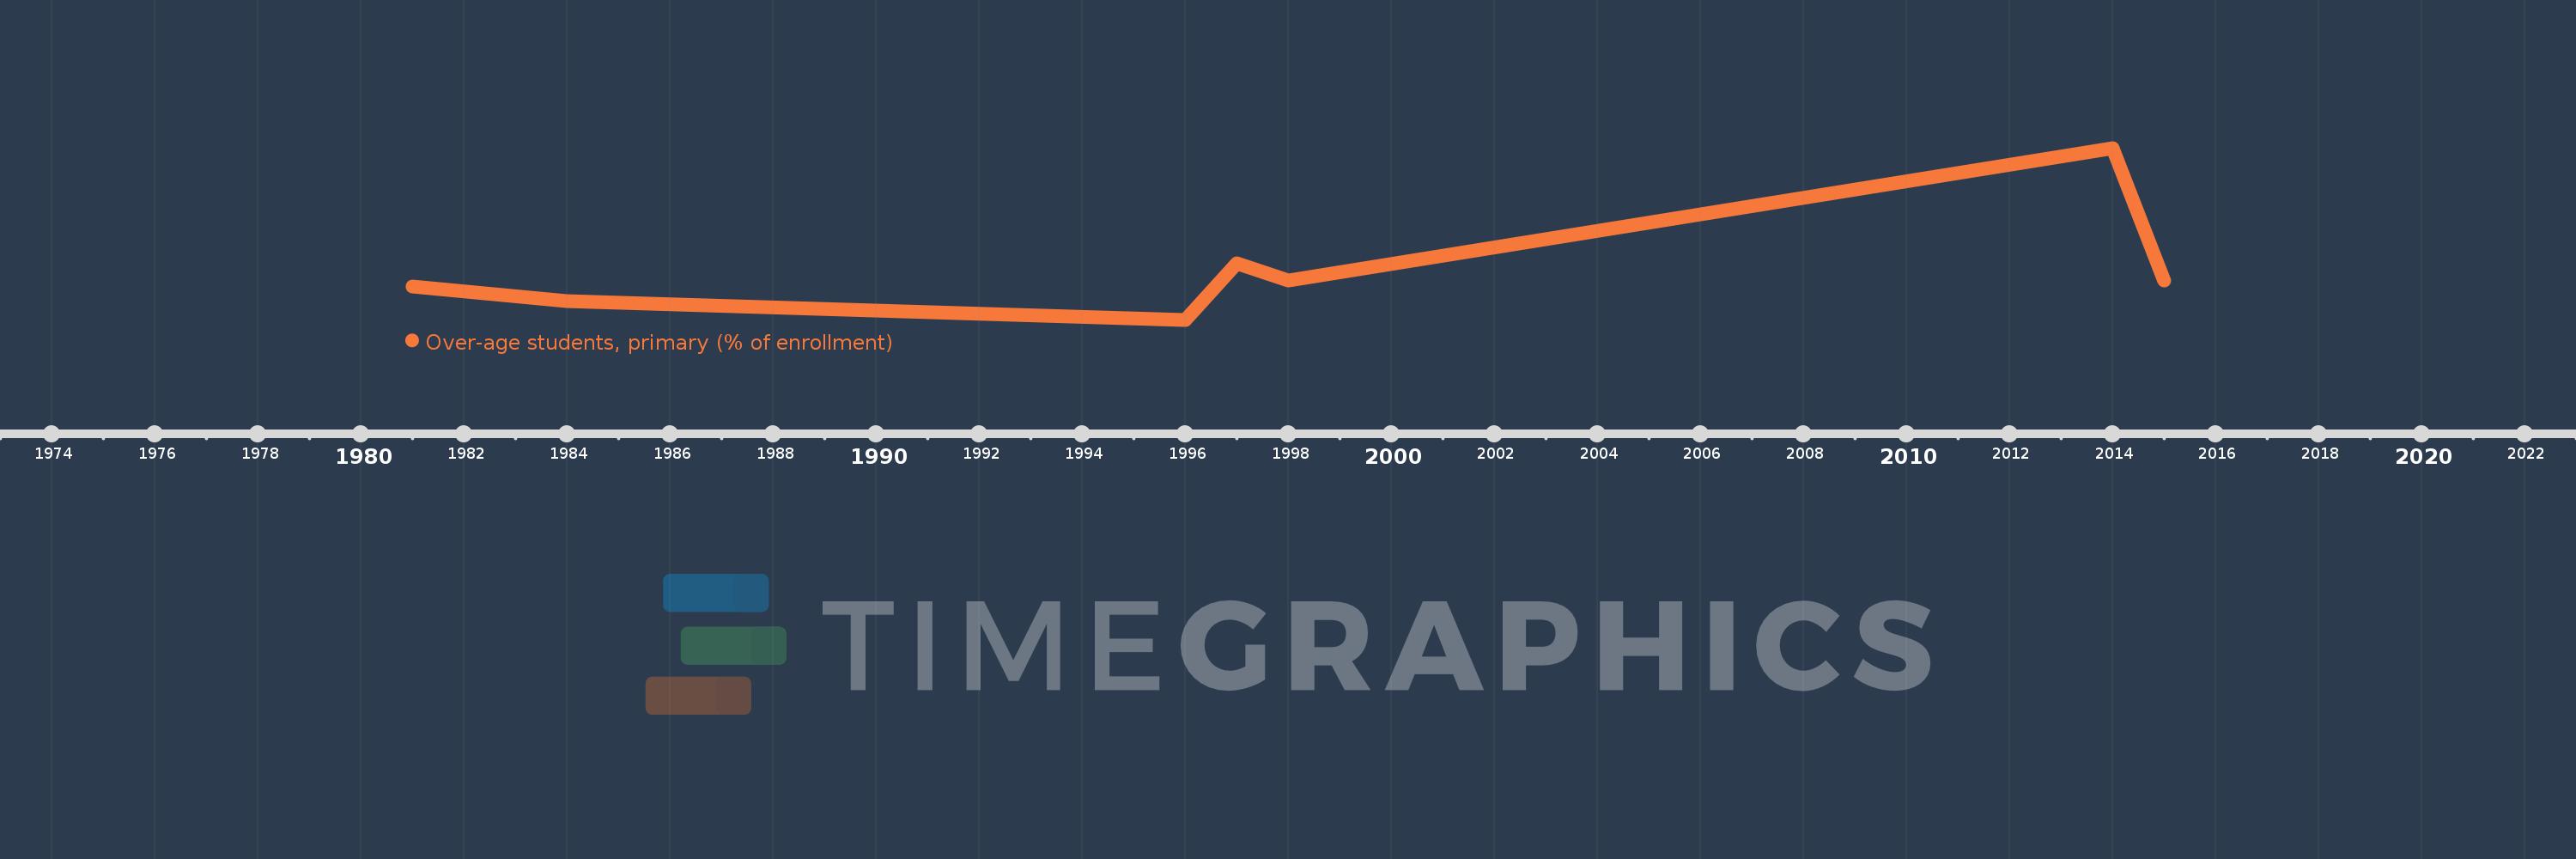
Timeline:
This timeline shows a graph from
1981
to
2015
of Mongolia. No data until
1980
. Number of actual observations by date:
7
.
Source name:
World Development Indicators
Source organization:
United Nations Educational, Scientific, and Cultural Organization (UNESCO) Institute for Statistics.
Categories, topics:
Education
Last updated:
apr 23, 2017
Indicators value changes by year
Meaning:
5.69
Minimum:
3.155
jan 1, 1996
Maximum:
11.662
jan 1, 2014
At the date of observation
Value
Absolute change
Change from the previous value
jan 1, 1981
4.794
+4.794
0.0%
jan 1, 1984
4.064
-0.73
-15.23%
jan 1, 1996
3.155
-0.909
-22.37%
jan 1, 1997
5.949
+2.794
88.57%
jan 1, 1998
5.096
-0.854
-14.35%
jan 1, 2014
11.662
+6.567
128.86%
jan 1, 2015
5.112
-6.55
-56.16%
Ranking of countries by current statistics by years
About & Feedback
Terms
Privacy
Library
2024
©
Time.Graphics
Support 24/7
Cabinet
Get premium
Donate
The service accepts bank transfer (ACH, Wire) or cards (Visa, MasterCard, etc). Processed by Stripe.
Secured with SSL
Excellent (Trustpilot Reviews)
Based on 115+ reviews
Write your own review on
Trustpilot.com
