29
/
en
AIzaSyAYiBZKx7MnpbEhh9jyipgxe19OcubqV5w
April 1, 2024
240820
Singapore
SGP
true
2
1
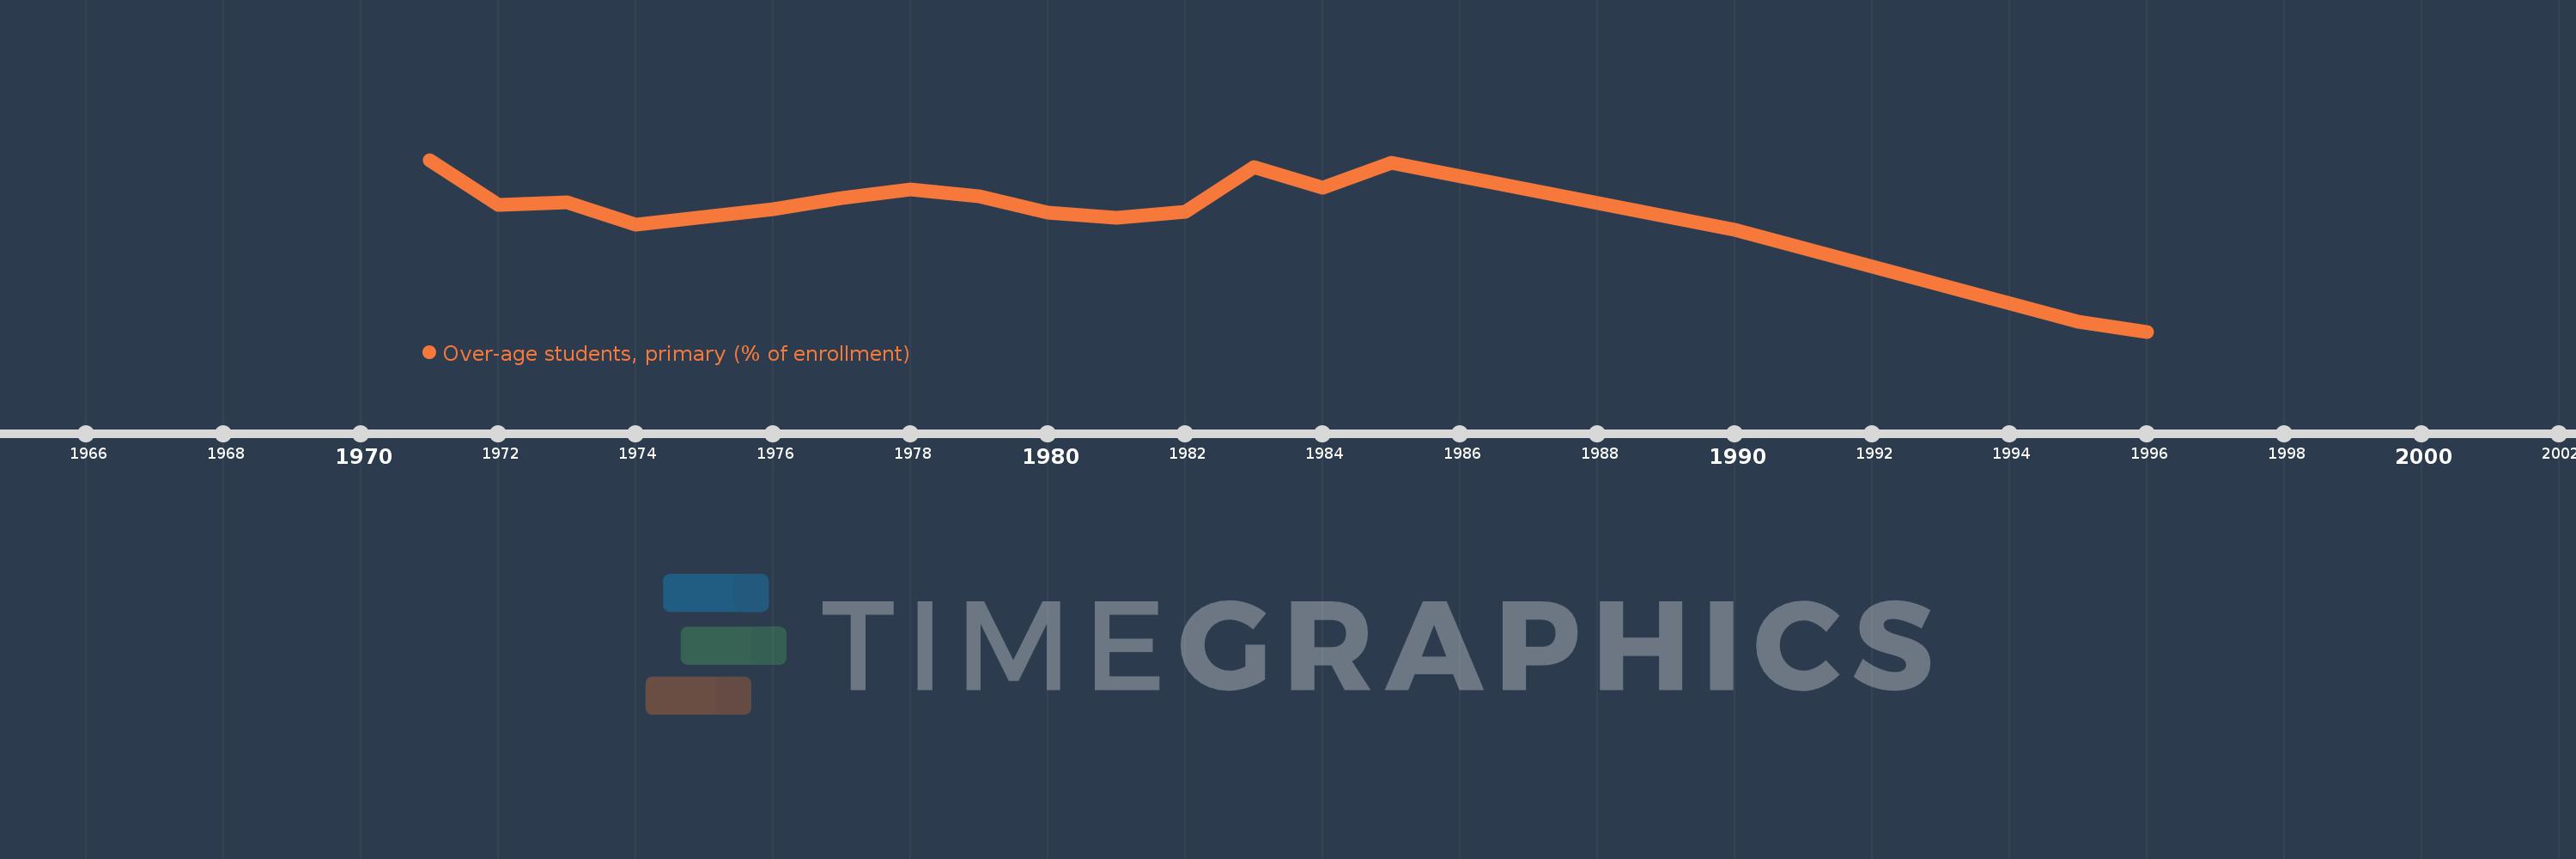
Over-age students, primary (% of enrollment)
1996,1995,1990,1985,1984,1983,1982,1981,1980,1979,1978,1977,1976,1975,1974,1973,1972,1971
This statistics in other country:
AfghanistanAlbaniaAlgeriaAndorraAngolaAntigua and BarbudaArgentinaArubaAustraliaAustriaAzerbaijanBahamas, TheBahrainBangladeshBarbadosBelarusBelgiumBelizeBeninBermudaBhutanBoliviaBosnia and HerzegovinaBotswanaBrazilBritish Virgin IslandsBrunei DarussalamBulgariaBurkina FasoBurundiCabo VerdeCambodiaCameroonCanadaCentral African RepublicChadChileChinaColombiaComorosCongo, Dem. Rep.Congo, Rep.Costa RicaCote d'IvoireCubaCyprusDenmarkDjiboutiDominicaDominican RepublicEcuadorEgypt, Arab Rep.El SalvadorEquatorial GuineaEritreaEstoniaEthiopiaFijiFinlandFranceGabonGambia, TheGeorgiaGermanyGhanaGreeceGrenadaGuatemalaGuineaGuinea-BissauGuyanaHaitiHondurasHong Kong SAR, ChinaHungaryIcelandIndiaIndonesiaIran, Islamic Rep.IraqIrelandItalyJamaicaJapanJordanKazakhstanKenyaKiribatiKorea, Dem. People’s Rep.Korea, Rep.KuwaitKyrgyz RepublicLao PDRLebanonLesothoLibyaLuxembourgMacao SAR, ChinaMadagascarMalawiMalaysiaMaldivesMaliMaltaMarshall IslandsMauritaniaMauritiusMexicoMoldovaMongoliaMontenegroMoroccoMozambiqueMyanmarNamibiaNepalNetherlandsNew ZealandNicaraguaNigerNorwayOmanPakistanPalauPanamaParaguayPeruPhilippinesPolandPortugalPuerto RicoQatarRussian FederationRwandaSamoaSan MarinoSao Tome and PrincipeSaudi ArabiaSenegalSerbiaSeychellesSierra LeoneSingaporeSint Maarten (Dutch part)SloveniaSolomon IslandsSomaliaSouth AfricaSouth SudanSpainSri LankaSt. Kitts and NevisSt. LuciaSt. Vincent and the GrenadinesSurinameSwazilandSwedenSwitzerlandSyrian Arab RepublicTajikistanTanzaniaThailandTimor-LesteTogoTongaTrinidad and TobagoTunisiaTurkeyTurks and Caicos IslandsTuvaluUgandaUkraineUnited Arab EmiratesUnited KingdomUnited StatesUruguayVanuatuVenezuela, RBVietnamZambiaZimbabwe Timeline:
This timeline shows a graph from 1971 to 1996 of Singapore. No data until 1970. Number of actual observations by date: 18.
Source name:
World Development Indicators
Source organization:
United Nations Educational, Scientific, and Cultural Organization (UNESCO) Institute for Statistics.
Categories, topics:
Education
Last updated:
apr 23, 2017
Indicators value changes by year
Maximum:
10.667
jan 1, 1971
At the date of observation
Value
Absolute change
Change from previous value
jan 1, 1971
10.667
+10.667
0.0%
jan 1, 1972
8.306
-2.361
-22.14%
jan 1, 1973
8.44
+0.134
1.61%
jan 1, 1974
7.284
-1.155
-13.69%
jan 1, 1975
7.684
+0.4
5.49%
jan 1, 1976
8.079
+0.395
5.14%
jan 1, 1977
8.651
+0.571
7.07%
jan 1, 1978
9.125
+0.475
5.49%
jan 1, 1979
8.763
-0.362
-3.97%
jan 1, 1980
7.897
-0.866
-9.89%
jan 1, 1981
7.65
-0.247
-3.13%
jan 1, 1982
7.951
+0.301
3.94%
jan 1, 1983
10.273
+2.321
29.19%
jan 1, 1984
9.199
-1.073
-10.45%
jan 1, 1985
10.507
+1.308
14.21%
jan 1, 1990
7.026
-3.481
-33.13%
jan 1, 1995
2.225
-4.8
-68.33%
jan 1, 1996
1.702
-0.523
-23.51%
Ranking of countries by current statistics by years


Comments: