29
/
en
AIzaSyAYiBZKx7MnpbEhh9jyipgxe19OcubqV5w
April 1, 2024
158806
Iraq
IRQ
true
2
1
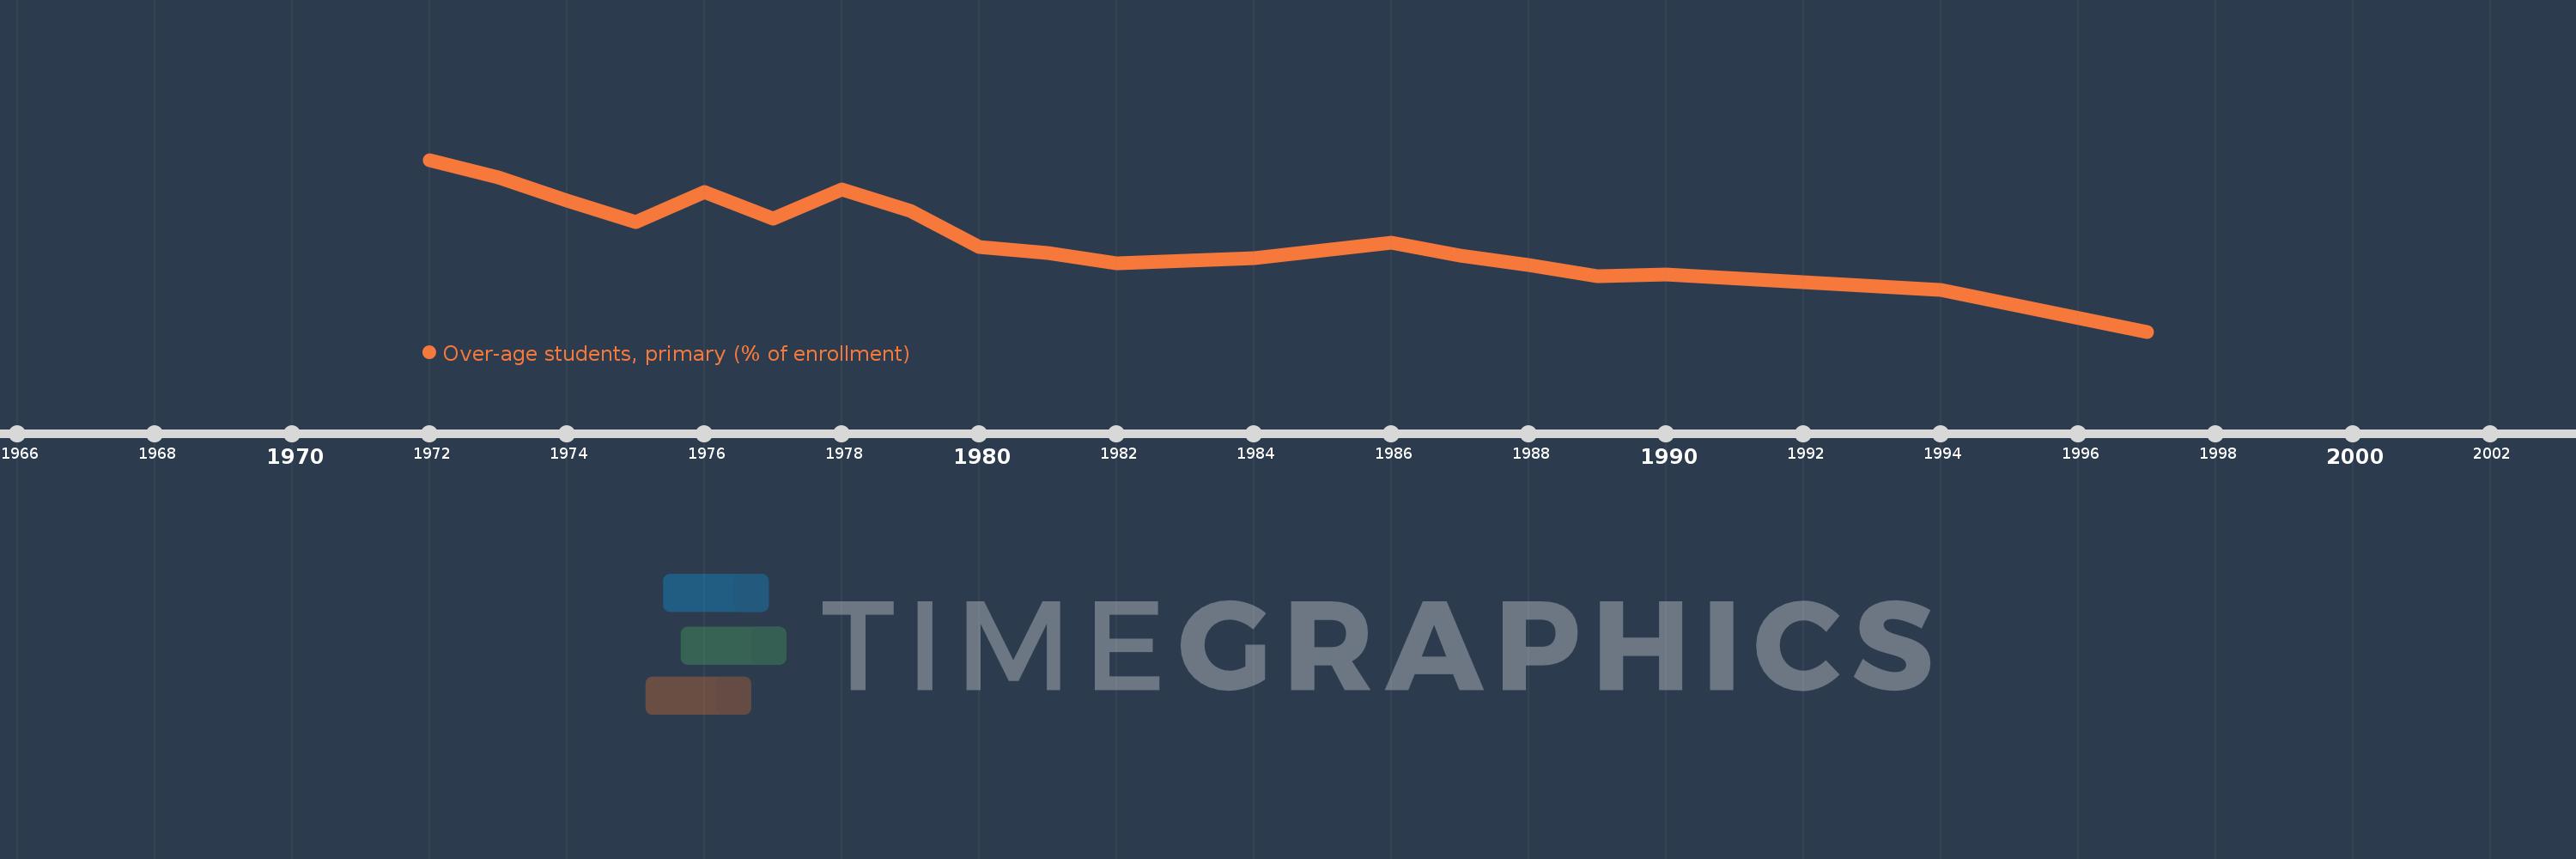
Over-age students, primary (% of enrollment)
1997,1994,1990,1989,1988,1987,1986,1984,1982,1981,1980,1979,1978,1977,1976,1975,1974,1973,1972
This statistics in other country:
AfghanistanAlbaniaAlgeriaAndorraAngolaAntigua and BarbudaArgentinaArubaAustraliaAustriaAzerbaijanBahamas, TheBahrainBangladeshBarbadosBelarusBelgiumBelizeBeninBermudaBhutanBoliviaBosnia and HerzegovinaBotswanaBrazilBritish Virgin IslandsBrunei DarussalamBulgariaBurkina FasoBurundiCabo VerdeCambodiaCameroonCanadaCentral African RepublicChadChileChinaColombiaComorosCongo, Dem. Rep.Congo, Rep.Costa RicaCote d'IvoireCubaCyprusDenmarkDjiboutiDominicaDominican RepublicEcuadorEgypt, Arab Rep.El SalvadorEquatorial GuineaEritreaEstoniaEthiopiaFijiFinlandFranceGabonGambia, TheGeorgiaGermanyGhanaGreeceGrenadaGuatemalaGuineaGuinea-BissauGuyanaHaitiHondurasHong Kong SAR, ChinaHungaryIcelandIndiaIndonesiaIran, Islamic Rep.IraqIrelandItalyJamaicaJapanJordanKazakhstanKenyaKiribatiKorea, Dem. People’s Rep.Korea, Rep.KuwaitKyrgyz RepublicLao PDRLebanonLesothoLibyaLuxembourgMacao SAR, ChinaMadagascarMalawiMalaysiaMaldivesMaliMaltaMarshall IslandsMauritaniaMauritiusMexicoMoldovaMongoliaMontenegroMoroccoMozambiqueMyanmarNamibiaNepalNetherlandsNew ZealandNicaraguaNigerNorwayOmanPakistanPalauPanamaParaguayPeruPhilippinesPolandPortugalPuerto RicoQatarRussian FederationRwandaSamoaSan MarinoSao Tome and PrincipeSaudi ArabiaSenegalSerbiaSeychellesSierra LeoneSingaporeSint Maarten (Dutch part)SloveniaSolomon IslandsSomaliaSouth AfricaSouth SudanSpainSri LankaSt. Kitts and NevisSt. LuciaSt. Vincent and the GrenadinesSurinameSwazilandSwedenSwitzerlandSyrian Arab RepublicTajikistanTanzaniaThailandTimor-LesteTogoTongaTrinidad and TobagoTunisiaTurkeyTurks and Caicos IslandsTuvaluUgandaUkraineUnited Arab EmiratesUnited KingdomUnited StatesUruguayVanuatuVenezuela, RBVietnamZambiaZimbabwe Timeline:
This timeline shows a graph from 1972 to 1997 of Iraq. No data until 1971. Number of actual observations by date: 19.
Source name:
World Development Indicators
Source organization:
United Nations Educational, Scientific, and Cultural Organization (UNESCO) Institute for Statistics.
Categories, topics:
Education
Last updated:
apr 23, 2017
Indicators value changes by year
Maximum:
19.475
jan 1, 1972
At the date of observation
Value
Absolute change
Change from previous value
jan 1, 1972
19.475
+19.475
0.0%
jan 1, 1973
18.395
-1.081
-5.55%
jan 1, 1974
16.908
-1.486
-8.08%
jan 1, 1975
15.591
-1.317
-7.79%
jan 1, 1976
17.45
+1.859
11.93%
jan 1, 1977
15.807
-1.643
-9.42%
jan 1, 1978
17.611
+1.804
11.41%
jan 1, 1979
16.287
-1.324
-7.52%
jan 1, 1980
14.026
-2.262
-13.89%
jan 1, 1981
13.659
-0.366
-2.61%
jan 1, 1982
13.049
-0.61
-4.47%
jan 1, 1984
13.343
+0.294
2.25%
jan 1, 1986
14.295
+0.952
7.13%
jan 1, 1987
13.52
-0.775
-5.42%
jan 1, 1988
12.902
-0.617
-4.56%
jan 1, 1989
12.236
-0.666
-5.16%
jan 1, 1990
12.35
+0.114
0.93%
jan 1, 1994
11.383
-0.967
-7.83%
jan 1, 1997
8.766
-2.617
-22.99%
Ranking of countries by current statistics by years


Comments: