29
/
en
AIzaSyAYiBZKx7MnpbEhh9jyipgxe19OcubqV5w
April 1, 2024
170345
Korea, Rep.
KOR
true
2
1
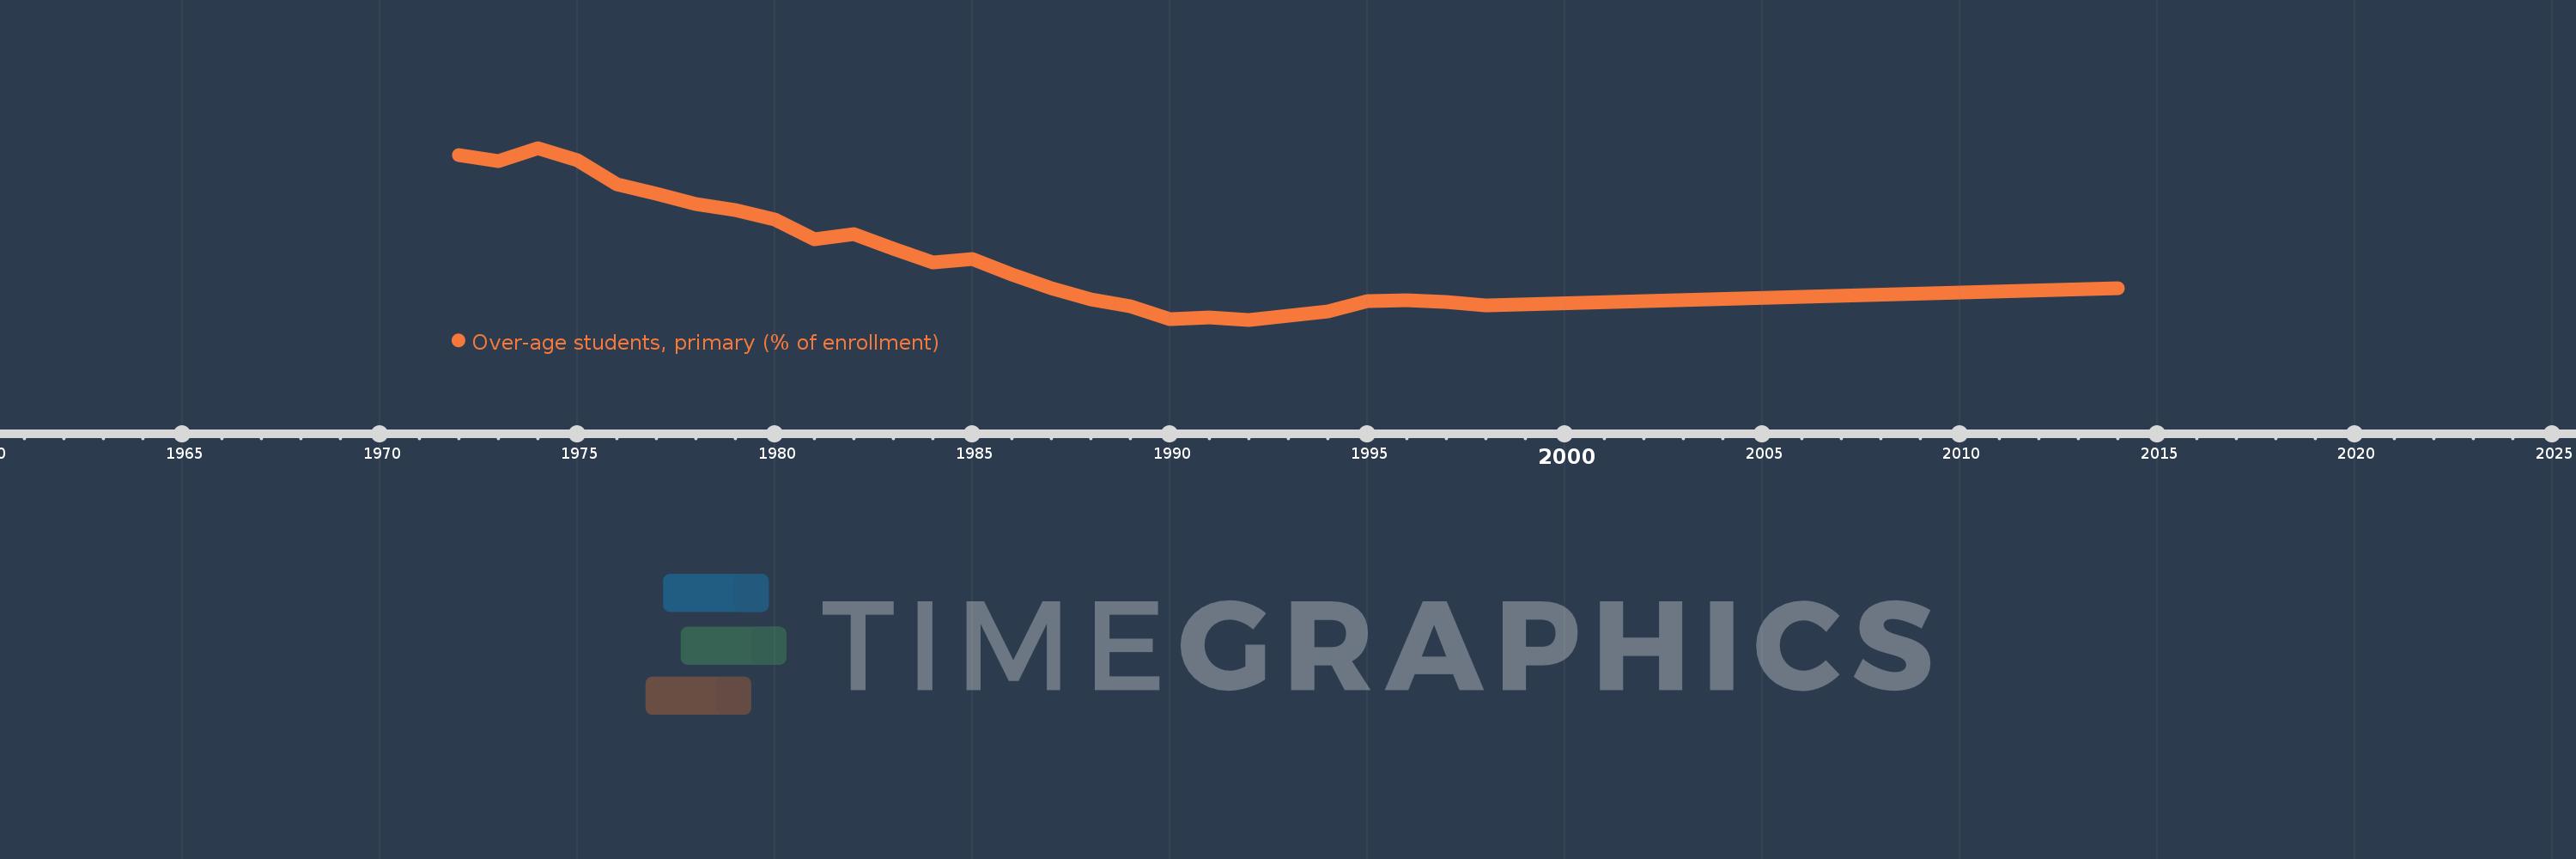
Over-age students, primary (% of enrollment)
2014,1998,1997,1996,1995,1994,1993,1992,1991,1990,1989,1988,1987,1986,1985,1984,1983,1982,1981,1980,1979,1978,1977,1976,1975,1974,1973,1972
This statistics in other country:
AfghanistanAlbaniaAlgeriaAndorraAngolaAntigua and BarbudaArgentinaArubaAustraliaAustriaAzerbaijanBahamas, TheBahrainBangladeshBarbadosBelarusBelgiumBelizeBeninBermudaBhutanBoliviaBosnia and HerzegovinaBotswanaBrazilBritish Virgin IslandsBrunei DarussalamBulgariaBurkina FasoBurundiCabo VerdeCambodiaCameroonCanadaCentral African RepublicChadChileChinaColombiaComorosCongo, Dem. Rep.Congo, Rep.Costa RicaCote d'IvoireCubaCyprusDenmarkDjiboutiDominicaDominican RepublicEcuadorEgypt, Arab Rep.El SalvadorEquatorial GuineaEritreaEstoniaEthiopiaFijiFinlandFranceGabonGambia, TheGeorgiaGermanyGhanaGreeceGrenadaGuatemalaGuineaGuinea-BissauGuyanaHaitiHondurasHong Kong SAR, ChinaHungaryIcelandIndiaIndonesiaIran, Islamic Rep.IraqIrelandItalyJamaicaJapanJordanKazakhstanKenyaKiribatiKorea, Dem. People’s Rep.Korea, Rep.KuwaitKyrgyz RepublicLao PDRLebanonLesothoLibyaLuxembourgMacao SAR, ChinaMadagascarMalawiMalaysiaMaldivesMaliMaltaMarshall IslandsMauritaniaMauritiusMexicoMoldovaMongoliaMontenegroMoroccoMozambiqueMyanmarNamibiaNepalNetherlandsNew ZealandNicaraguaNigerNorwayOmanPakistanPalauPanamaParaguayPeruPhilippinesPolandPortugalPuerto RicoQatarRussian FederationRwandaSamoaSan MarinoSao Tome and PrincipeSaudi ArabiaSenegalSerbiaSeychellesSierra LeoneSingaporeSint Maarten (Dutch part)SloveniaSolomon IslandsSomaliaSouth AfricaSouth SudanSpainSri LankaSt. Kitts and NevisSt. LuciaSt. Vincent and the GrenadinesSurinameSwazilandSwedenSwitzerlandSyrian Arab RepublicTajikistanTanzaniaThailandTimor-LesteTogoTongaTrinidad and TobagoTunisiaTurkeyTurks and Caicos IslandsTuvaluUgandaUkraineUnited Arab EmiratesUnited KingdomUnited StatesUruguayVanuatuVenezuela, RBVietnamZambiaZimbabwe Timeline:
This timeline shows a graph from 1972 to 2014 of Korea, Rep.. No data until 1971. Number of actual observations by date: 28.
Source name:
World Development Indicators
Source organization:
United Nations Educational, Scientific, and Cultural Organization (UNESCO) Institute for Statistics.
Categories, topics:
Education
Last updated:
apr 23, 2017
Indicators value changes by year
At the date of observation
Value
Absolute change
Change from previous value
jan 1, 1972
8.662
+8.662
0.0%
jan 1, 1973
8.417
-0.245
-2.83%
jan 1, 1974
8.993
+0.576
6.85%
jan 1, 1975
8.422
-0.571
-6.35%
jan 1, 1976
7.357
-1.065
-12.64%
jan 1, 1977
6.909
-0.448
-6.1%
jan 1, 1978
6.45
-0.459
-6.65%
jan 1, 1979
6.176
-0.274
-4.24%
jan 1, 1980
5.753
-0.423
-6.84%
jan 1, 1981
4.865
-0.888
-15.44%
jan 1, 1982
5.077
+0.211
4.34%
jan 1, 1983
4.439
-0.638
-12.56%
jan 1, 1984
3.817
-0.622
-14.01%
jan 1, 1985
3.952
+0.135
3.54%
jan 1, 1986
3.265
-0.686
-17.37%
jan 1, 1987
2.639
-0.626
-19.18%
jan 1, 1988
2.142
-0.497
-18.82%
jan 1, 1989
1.832
-0.31
-14.49%
jan 1, 1990
1.255
-0.577
-31.48%
jan 1, 1991
1.326
+0.071
5.63%
jan 1, 1992
1.218
-0.108
-8.12%
jan 1, 1993
1.402
+0.184
15.09%
jan 1, 1994
1.592
+0.19
13.56%
jan 1, 1995
2.052
+0.46
28.86%
jan 1, 1996
2.085
+0.033
1.61%
jan 1, 1997
2.017
-0.068
-3.24%
jan 1, 1998
1.862
-0.155
-7.68%
jan 1, 2014
2.647
+0.785
42.14%
Ranking of countries by current statistics by years


Comments: