29
/
en
AIzaSyAYiBZKx7MnpbEhh9jyipgxe19OcubqV5w
April 1, 2024
168909
Kiribati
KIR
true
2
1
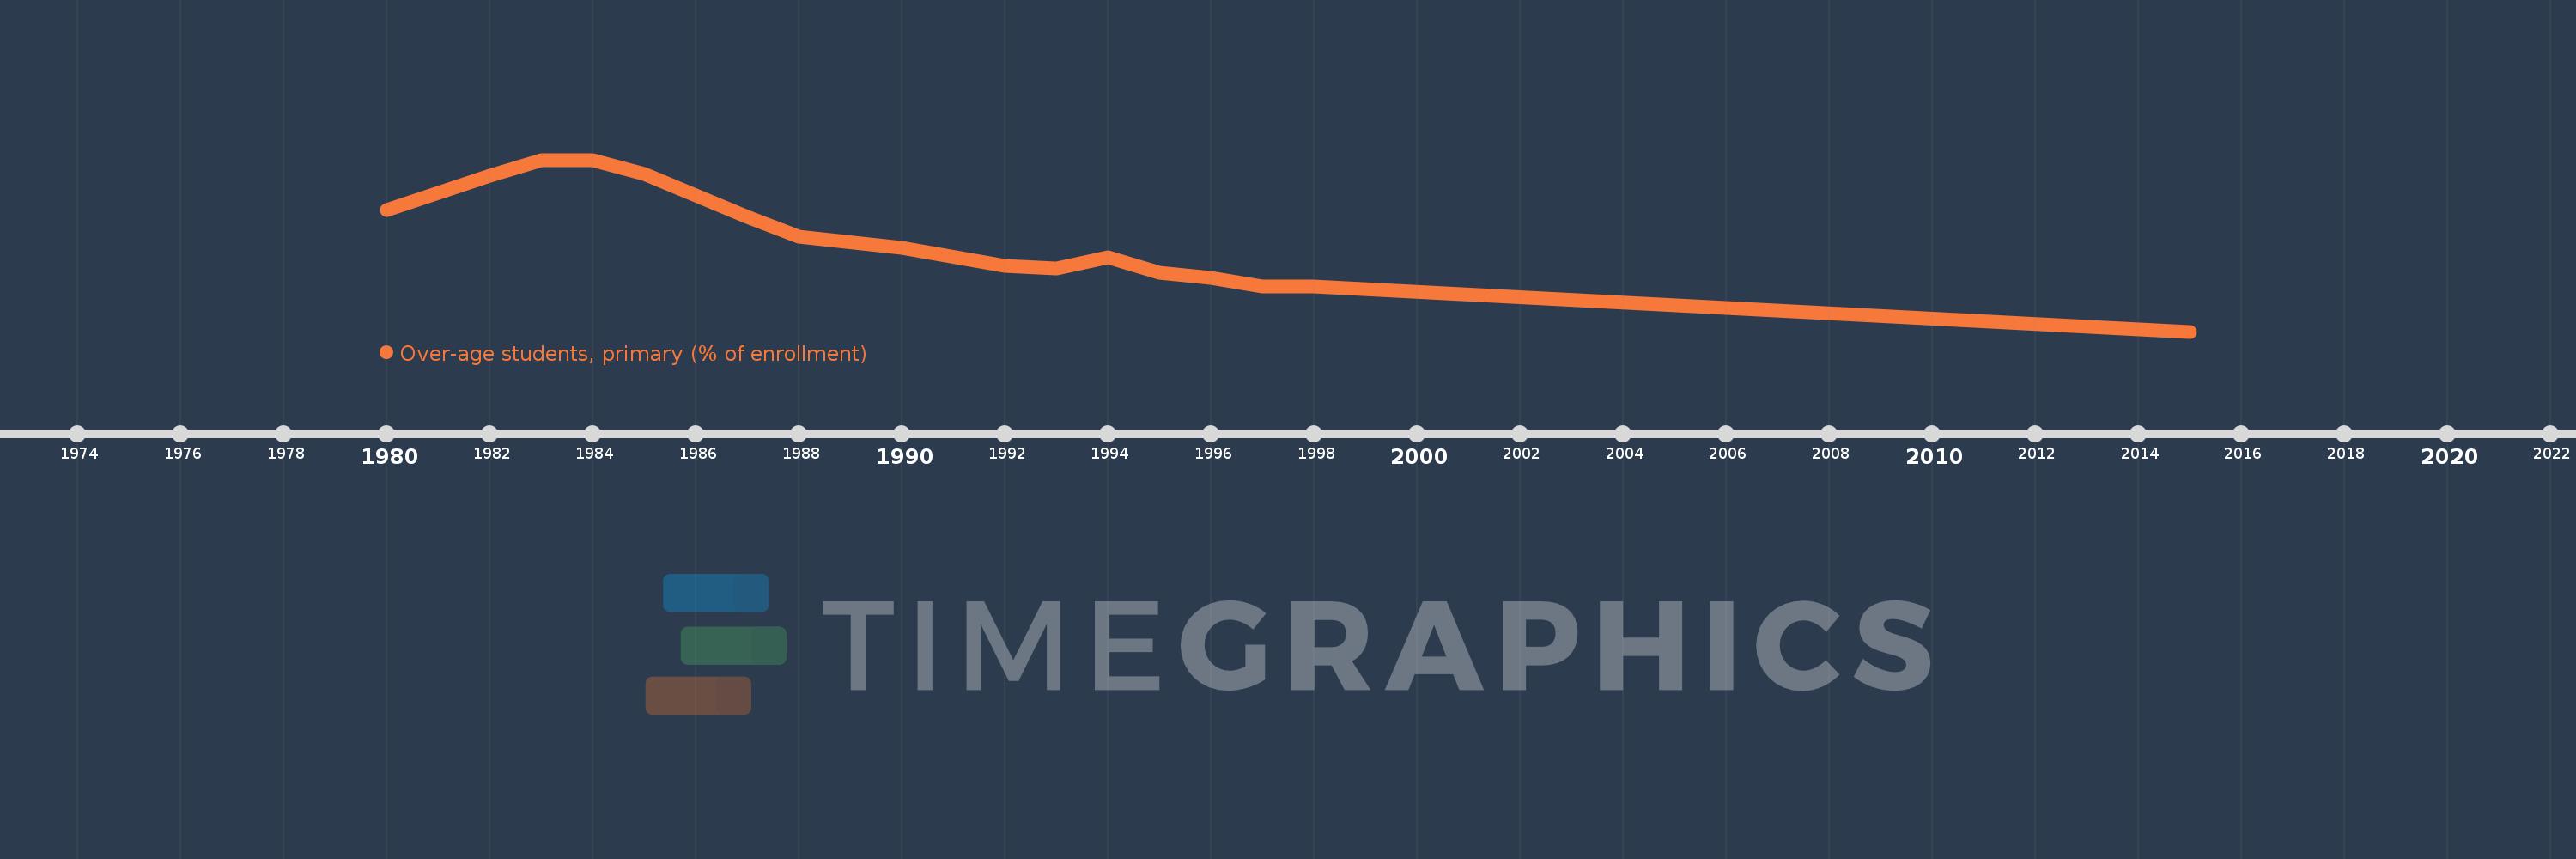
Over-age students, primary (% of enrollment)
2015,1998,1997,1996,1995,1994,1993,1992,1990,1988,1987,1986,1985,1984,1983,1982,1980
This statistics in other country:
AfghanistanAlbaniaAlgeriaAndorraAngolaAntigua and BarbudaArgentinaArubaAustraliaAustriaAzerbaijanBahamas, TheBahrainBangladeshBarbadosBelarusBelgiumBelizeBeninBermudaBhutanBoliviaBosnia and HerzegovinaBotswanaBrazilBritish Virgin IslandsBrunei DarussalamBulgariaBurkina FasoBurundiCabo VerdeCambodiaCameroonCanadaCentral African RepublicChadChileChinaColombiaComorosCongo, Dem. Rep.Congo, Rep.Costa RicaCote d'IvoireCubaCyprusDenmarkDjiboutiDominicaDominican RepublicEcuadorEgypt, Arab Rep.El SalvadorEquatorial GuineaEritreaEstoniaEthiopiaFijiFinlandFranceGabonGambia, TheGeorgiaGermanyGhanaGreeceGrenadaGuatemalaGuineaGuinea-BissauGuyanaHaitiHondurasHong Kong SAR, ChinaHungaryIcelandIndiaIndonesiaIran, Islamic Rep.IraqIrelandItalyJamaicaJapanJordanKazakhstanKenyaKiribatiKorea, Dem. People’s Rep.Korea, Rep.KuwaitKyrgyz RepublicLao PDRLebanonLesothoLibyaLuxembourgMacao SAR, ChinaMadagascarMalawiMalaysiaMaldivesMaliMaltaMarshall IslandsMauritaniaMauritiusMexicoMoldovaMongoliaMontenegroMoroccoMozambiqueMyanmarNamibiaNepalNetherlandsNew ZealandNicaraguaNigerNorwayOmanPakistanPalauPanamaParaguayPeruPhilippinesPolandPortugalPuerto RicoQatarRussian FederationRwandaSamoaSan MarinoSao Tome and PrincipeSaudi ArabiaSenegalSerbiaSeychellesSierra LeoneSingaporeSint Maarten (Dutch part)SloveniaSolomon IslandsSomaliaSouth AfricaSouth SudanSpainSri LankaSt. Kitts and NevisSt. LuciaSt. Vincent and the GrenadinesSurinameSwazilandSwedenSwitzerlandSyrian Arab RepublicTajikistanTanzaniaThailandTimor-LesteTogoTongaTrinidad and TobagoTunisiaTurkeyTurks and Caicos IslandsTuvaluUgandaUkraineUnited Arab EmiratesUnited KingdomUnited StatesUruguayVanuatuVenezuela, RBVietnamZambiaZimbabwe Timeline:
This timeline shows a graph from 1980 to 2015 of Kiribati. No data until 1979. Number of actual observations by date: 17.
Source name:
World Development Indicators
Source organization:
United Nations Educational, Scientific, and Cultural Organization (UNESCO) Institute for Statistics.
Categories, topics:
Education
Last updated:
apr 23, 2017
Indicators value changes by year
Maximum:
22.297
jan 1, 1983
At the date of observation
Value
Absolute change
Change from previous value
jan 1, 1980
17.708
+17.708
0.0%
jan 1, 1982
20.862
+3.155
17.81%
jan 1, 1983
22.297
+1.435
6.88%
jan 1, 1984
22.223
-0.074
-0.33%
jan 1, 1985
20.979
-1.244
-5.6%
jan 1, 1986
19.092
-1.887
-8.99%
jan 1, 1987
17.125
-1.967
-10.3%
jan 1, 1988
15.292
-1.833
-10.7%
jan 1, 1990
14.343
-0.95
-6.21%
jan 1, 1992
12.691
-1.652
-11.51%
jan 1, 1993
12.428
-0.263
-2.07%
jan 1, 1994
13.441
+1.013
8.15%
jan 1, 1995
12.071
-1.369
-10.19%
jan 1, 1996
11.559
-0.512
-4.24%
jan 1, 1997
10.828
-0.731
-6.32%
jan 1, 1998
10.782
-0.046
-0.43%
jan 1, 2015
6.707
-4.075
-37.79%
Ranking of countries by current statistics by years


Comments: