30
/
AIzaSyAYiBZKx7MnpbEhh9jyipgxe19OcubqV5w
April 1, 2024
190951
Mali
MLI
true
2
1
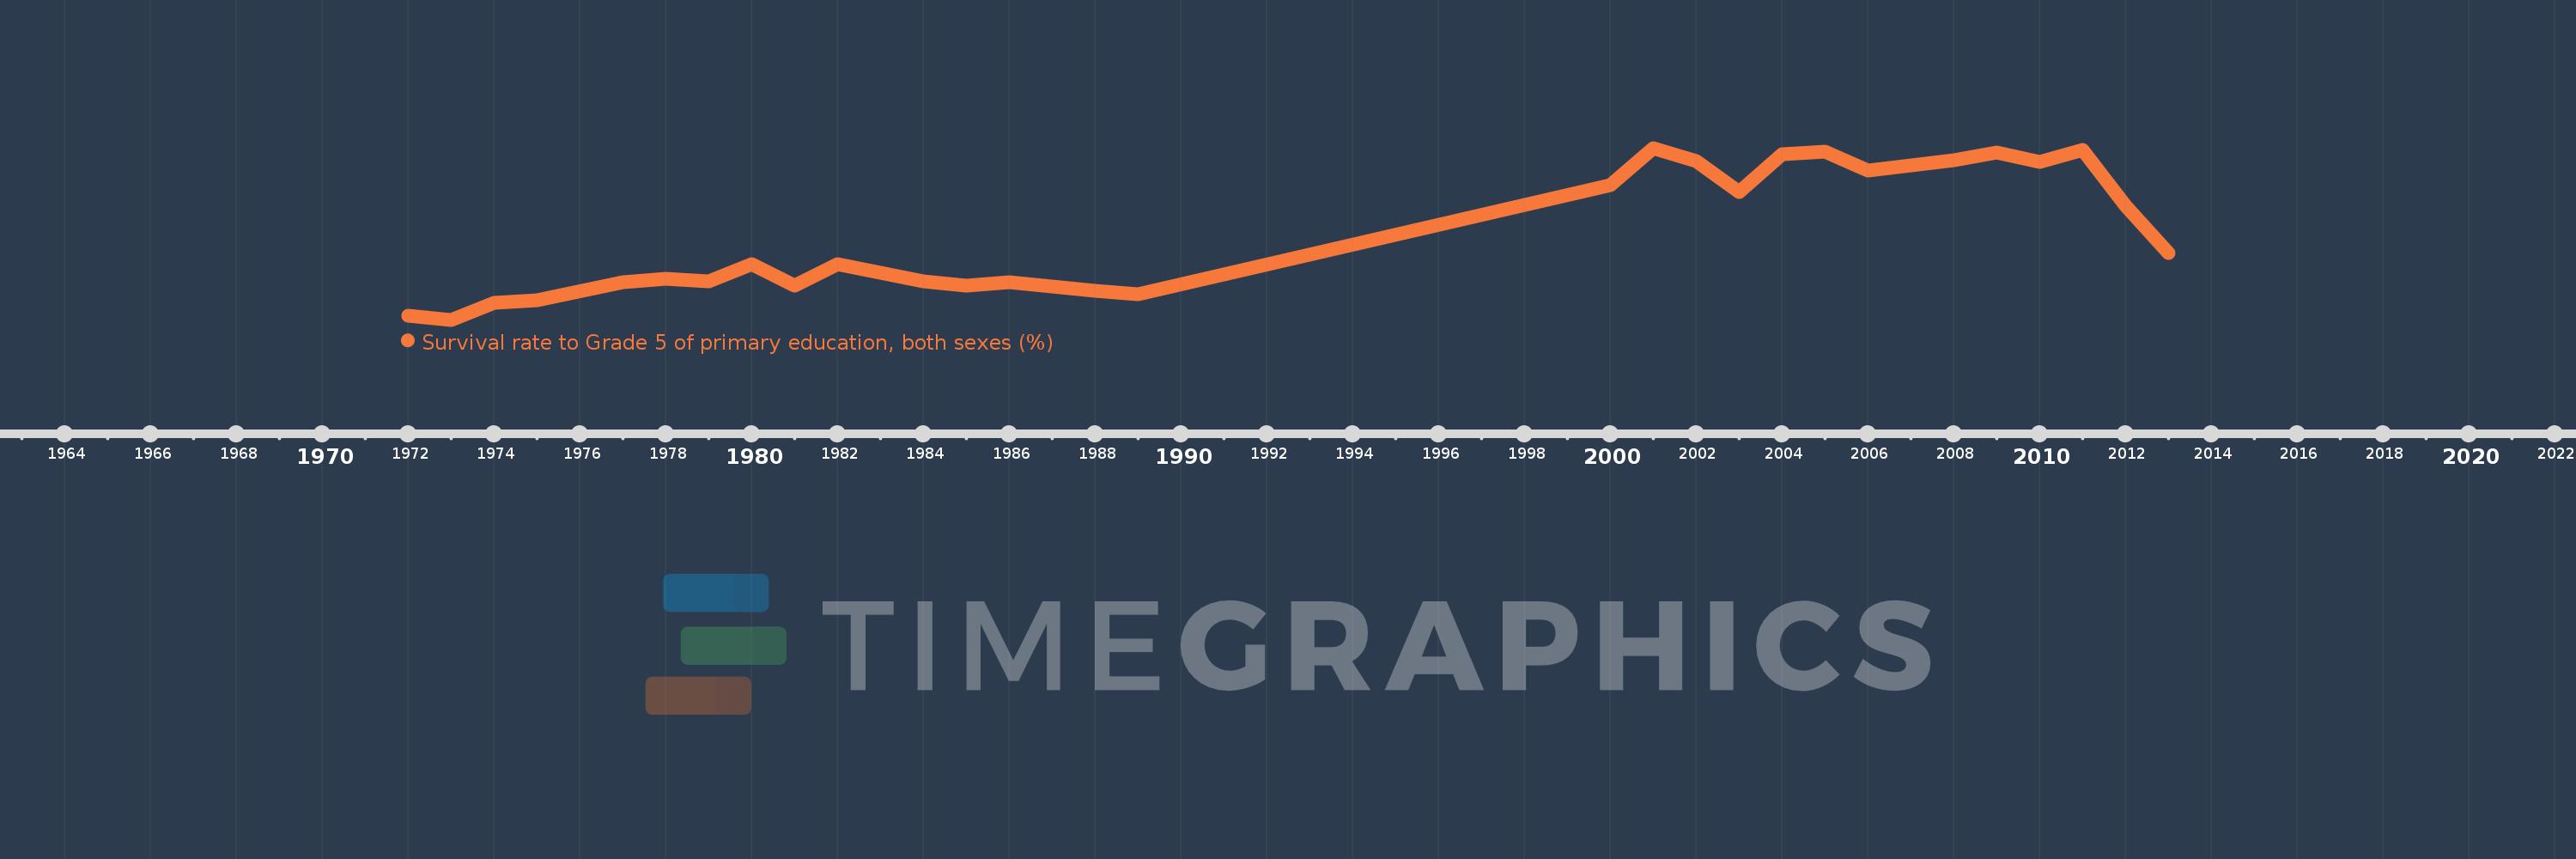
Survival rate to Grade 5 of primary education, both sexes (%)
2013,2012,2011,2010,2009,2008,2006,2005,2004,2003,2002,2001,2000,1989,1988,1987,1986,1985,1984,1982,1981,1980,1979,1978,1977,1975,1974,1973,1972
