29
/
en
AIzaSyAYiBZKx7MnpbEhh9jyipgxe19OcubqV5w
April 1, 2024
178321
Lesotho
LSO
true
2
1
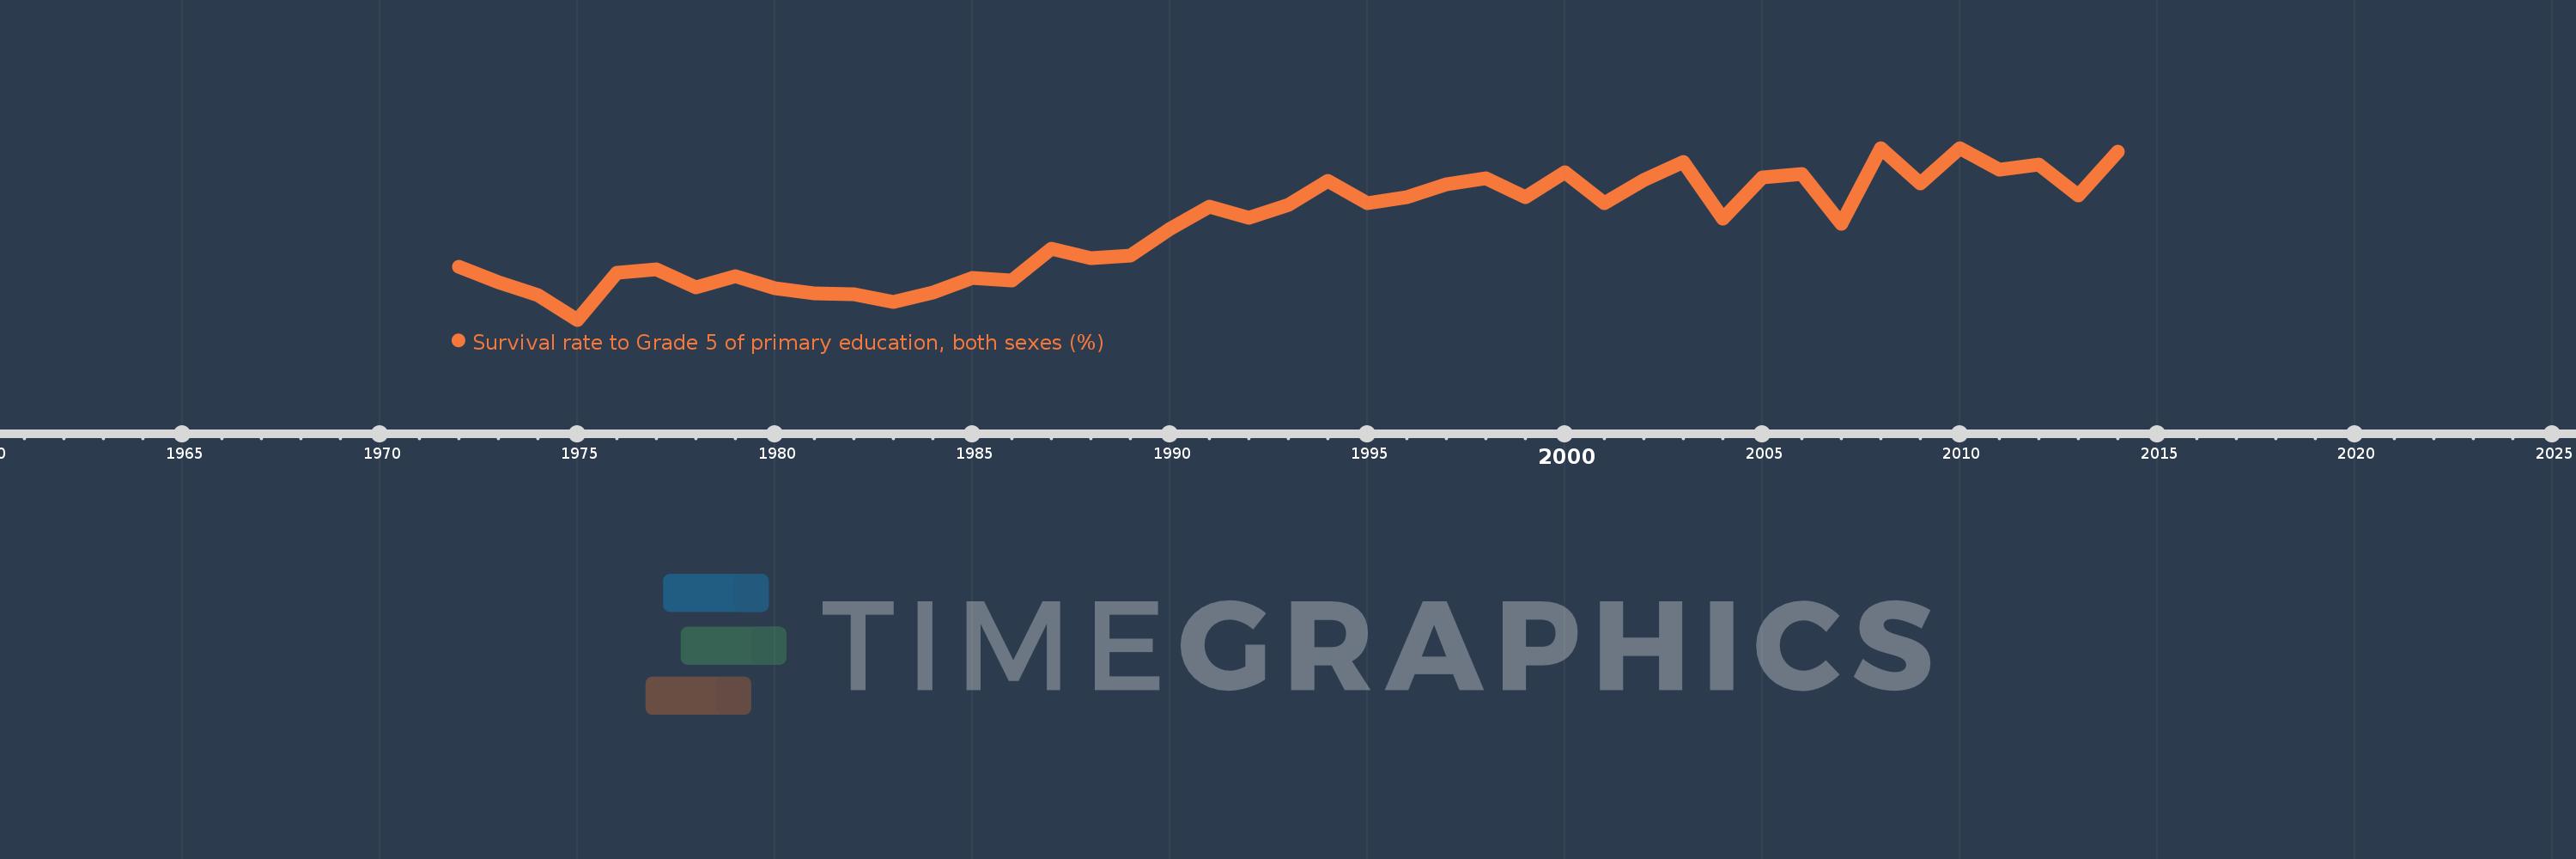
Survival rate to Grade 5 of primary education, both sexes (%)
2014,2013,2012,2011,2010,2009,2008,2007,2006,2005,2004,2003,2002,2001,2000,1999,1998,1997,1996,1995,1994,1993,1992,1991,1990,1989,1988,1987,1986,1985,1984,1983,1982,1981,1980,1979,1978,1977,1976,1975,1974,1973,1972
This statistics in other country:
AfghanistanAlbaniaAlgeriaAndorraAngolaAntigua and BarbudaArab WorldArgentinaArubaBahamas, TheBahrainBangladeshBarbadosBelarusBelgiumBelizeBeninBermudaBhutanBoliviaBosnia and HerzegovinaBotswanaBritish Virgin IslandsBrunei DarussalamBurkina FasoBurundiCabo VerdeCambodiaCameroonCanadaCaribbean small statesCayman IslandsCentral African RepublicChadChileChinaColombiaComorosCongo, Dem. Rep.Congo, Rep.Costa RicaCote d'IvoireCubaCyprusCzech RepublicDenmarkDjiboutiDominicaDominican RepublicEarly-demographic dividendEast Asia & PacificEast Asia & Pacific (excluding high income)East Asia & Pacific (IDA & IBRD countries)EcuadorEgypt, Arab Rep.El SalvadorEquatorial GuineaEritreaEstoniaEthiopiaFijiFinlandFranceGabonGambia, TheGeorgiaGhanaGreeceGrenadaGuatemalaGuineaGuinea-BissauGuyanaHaitiHeavily indebted poor countries (HIPC)HondurasHong Kong SAR, ChinaHungaryIBRD onlyIcelandIDA blendIDA onlyIDA totalIndiaIndonesiaIran, Islamic Rep.IraqIrelandIsraelItalyJamaicaJapanJordanKenyaKiribatiKorea, Rep.KuwaitLao PDRLate-demographic dividendLatviaLeast developed countries: UN classificationLebanonLesothoLiberiaLibyaLiechtensteinLow incomeLower middle incomeLuxembourgMacao SAR, ChinaMadagascarMalawiMalaysiaMaldivesMaliMaltaMarshall IslandsMauritaniaMauritiusMexicoMiddle East & North AfricaMiddle East & North Africa (excluding high income)Middle East & North Africa (IDA & IBRD countries)MonacoMontenegroMoroccoMozambiqueMyanmarNamibiaNepalNetherlandsNicaraguaNigerNigeriaNorwayOmanOther small statesPacific island small statesPakistanPanamaPapua New GuineaParaguayPeruPhilippinesPolandPortugalPre-demographic dividendQatarRwandaSamoaSan MarinoSao Tome and PrincipeSaudi ArabiaSenegalSeychellesSierra LeoneSingaporeSloveniaSolomon IslandsSouth AfricaSouth AsiaSouth Asia (IDA & IBRD)SpainSri LankaSt. Kitts and NevisSt. LuciaSt. Vincent and the GrenadinesSub-Saharan Africa Sub-Saharan Africa (excluding high income)Sub-Saharan Africa (IDA & IBRD countries)SudanSurinameSwazilandSwedenSwitzerlandSyrian Arab RepublicTanzaniaThailandTimor-LesteTogoTongaTrinidad and TobagoTunisiaTurkeyTuvaluUgandaUnited Arab EmiratesUpper middle incomeUruguayVanuatuVenezuela, RBVietnamYemen, Rep.ZambiaZimbabwe Timeline:
This timeline shows a graph from 1972 to 2014 of Lesotho. No data until 1971. Number of actual observations by date: 43.
Source name:
World Development Indicators
Source organization:
UNESCO Institute for Statistics
Categories, topics:
Education
Last updated:
apr 23, 2017
Indicators value changes by year
Minimum:
39.228
jan 1, 1975
Maximum:
80.476
jan 1, 2010
At the date of observation
Value
Absolute change
Change from previous value
jan 1, 1972
51.885
+51.885
0.0%
jan 1, 1973
48.21
-3.675
-7.08%
jan 1, 1974
45.049
-3.16
-6.56%
jan 1, 1975
39.228
-5.821
-12.92%
jan 1, 1976
50.515
+11.288
28.77%
jan 1, 1977
51.373
+0.858
1.7%
jan 1, 1978
47.07
-4.303
-8.38%
jan 1, 1979
49.696
+2.626
5.58%
jan 1, 1980
46.797
-2.899
-5.83%
jan 1, 1981
45.635
-1.162
-2.48%
jan 1, 1982
45.405
-0.23
-0.51%
jan 1, 1983
43.412
-1.992
-4.39%
jan 1, 1984
45.787
+2.375
5.47%
jan 1, 1985
49.21
+3.423
7.48%
jan 1, 1986
48.695
-0.515
-1.05%
jan 1, 1987
56.261
+7.566
15.54%
jan 1, 1988
54.06
-2.201
-3.91%
jan 1, 1989
54.569
+0.51
0.94%
jan 1, 1990
61.042
+6.472
11.86%
jan 1, 1991
66.309
+5.268
8.63%
jan 1, 1992
63.769
-2.541
-3.83%
jan 1, 1993
66.9
+3.132
4.91%
jan 1, 1994
72.583
+5.683
8.49%
jan 1, 1995
67.143
-5.441
-7.5%
jan 1, 1996
68.672
+1.53
2.28%
jan 1, 1997
71.651
+2.979
4.34%
jan 1, 1998
73.136
+1.485
2.07%
jan 1, 1999
68.75
-4.385
-6.0%
jan 1, 2000
74.562
+5.812
8.45%
jan 1, 2001
67.16
-7.402
-9.93%
jan 1, 2002
72.816
+5.656
8.42%
jan 1, 2003
77.028
+4.212
5.78%
jan 1, 2004
63.423
-13.605
-17.66%
jan 1, 2005
73.373
+9.95
15.69%
jan 1, 2006
74.31
+0.936
1.28%
jan 1, 2007
62.168
-12.142
-16.34%
jan 1, 2008
80.411
+18.244
29.35%
jan 1, 2009
72.004
-8.407
-10.45%
jan 1, 2010
80.476
+8.472
11.77%
jan 1, 2011
75.35
-5.126
-6.37%
jan 1, 2012
76.435
+1.085
1.44%
jan 1, 2013
69.081
-7.355
-9.62%
jan 1, 2014
79.561
+10.48
15.17%
Ranking of countries by current statistics by years


Comments: