29
/
en
AIzaSyAYiBZKx7MnpbEhh9jyipgxe19OcubqV5w
April 1, 2024
98004
Cabo Verde
CPV
true
2
1
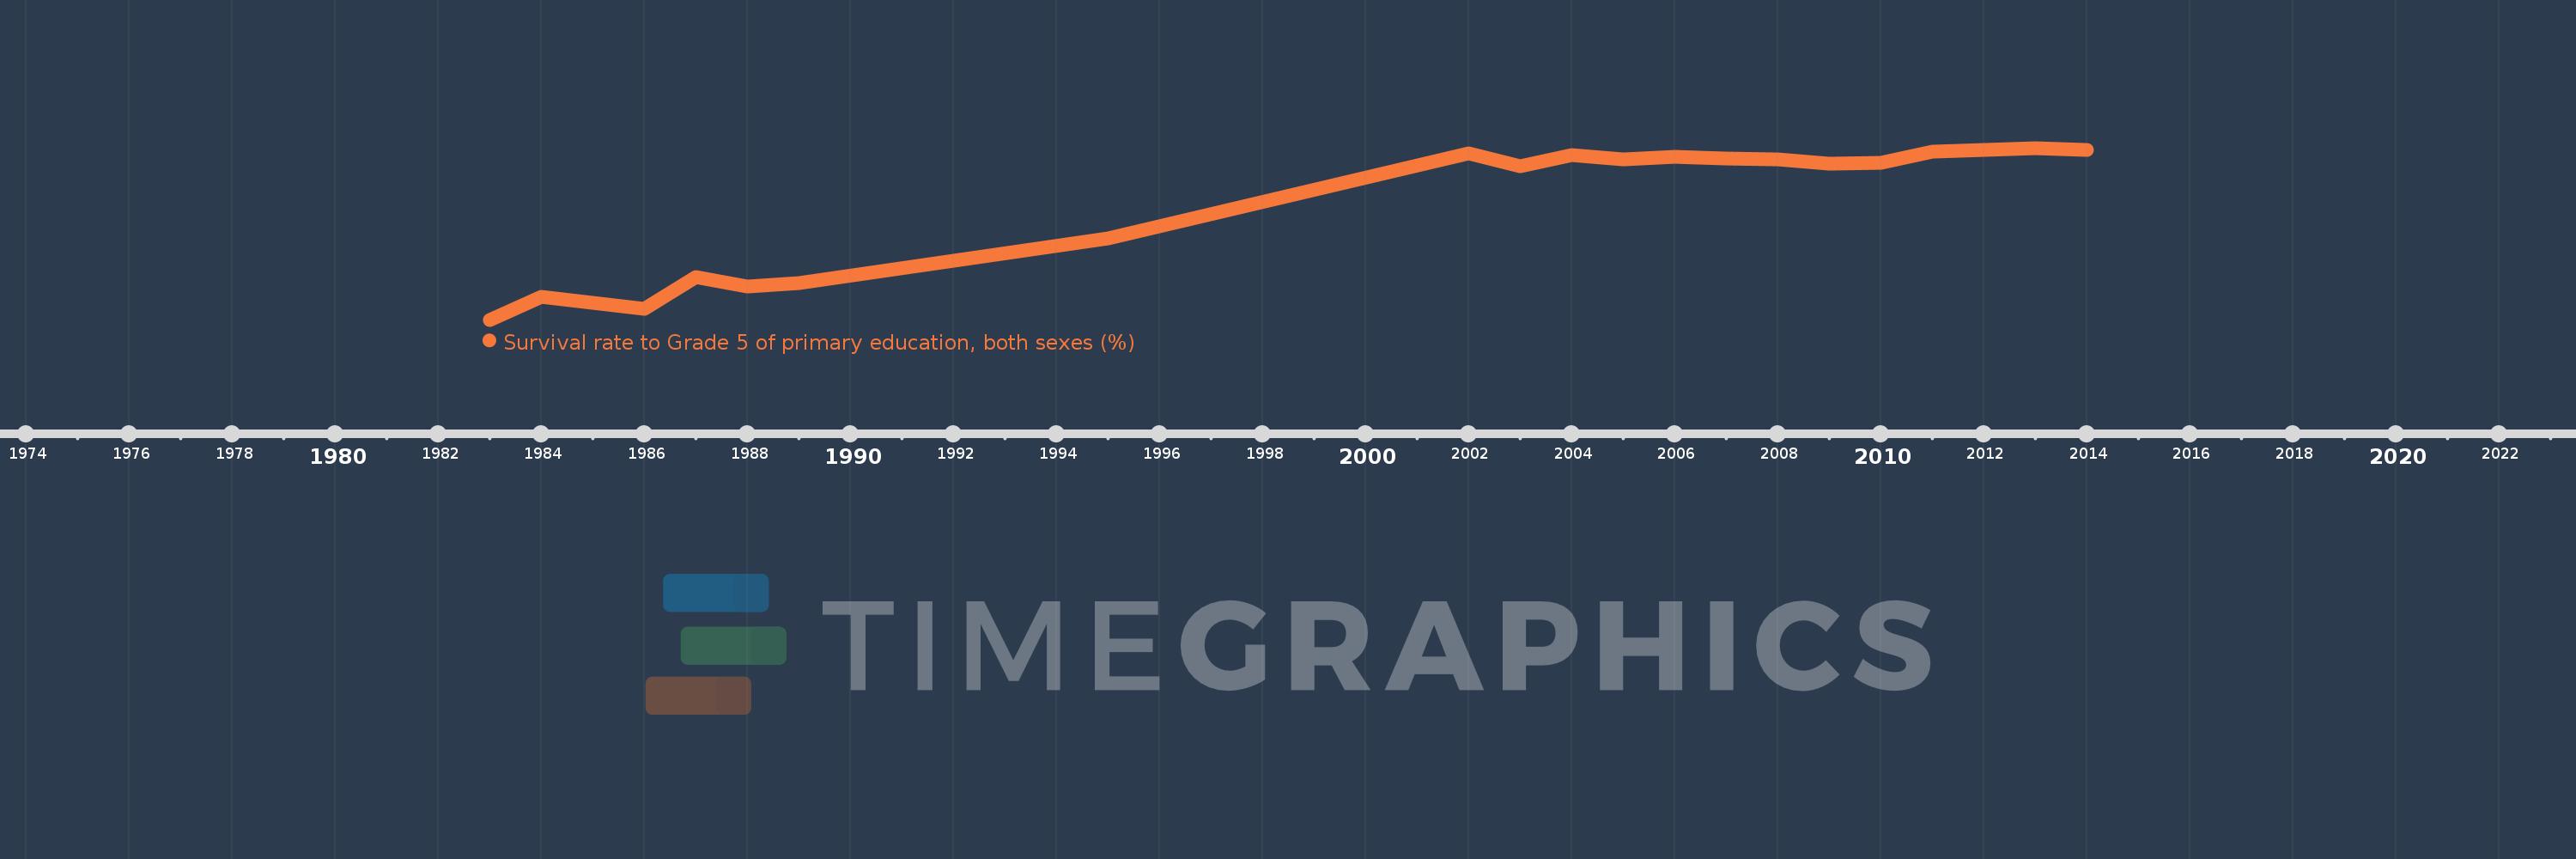
Survival rate to Grade 5 of primary education, both sexes (%)
2014,2013,2011,2010,2009,2008,2007,2006,2005,2004,2003,2002,1995,1989,1988,1987,1986,1984,1983
This statistics in other country:
AfghanistanAlbaniaAlgeriaAndorraAngolaAntigua and BarbudaArab WorldArgentinaArubaBahamas, TheBahrainBangladeshBarbadosBelarusBelgiumBelizeBeninBermudaBhutanBoliviaBosnia and HerzegovinaBotswanaBritish Virgin IslandsBrunei DarussalamBurkina FasoBurundiCabo VerdeCambodiaCameroonCanadaCaribbean small statesCayman IslandsCentral African RepublicChadChileChinaColombiaComorosCongo, Dem. Rep.Congo, Rep.Costa RicaCote d'IvoireCubaCyprusCzech RepublicDenmarkDjiboutiDominicaDominican RepublicEarly-demographic dividendEast Asia & PacificEast Asia & Pacific (excluding high income)East Asia & Pacific (IDA & IBRD countries)EcuadorEgypt, Arab Rep.El SalvadorEquatorial GuineaEritreaEstoniaEthiopiaFijiFinlandFranceGabonGambia, TheGeorgiaGhanaGreeceGrenadaGuatemalaGuineaGuinea-BissauGuyanaHaitiHeavily indebted poor countries (HIPC)HondurasHong Kong SAR, ChinaHungaryIBRD onlyIcelandIDA blendIDA onlyIDA totalIndiaIndonesiaIran, Islamic Rep.IraqIrelandIsraelItalyJamaicaJapanJordanKenyaKiribatiKorea, Rep.KuwaitLao PDRLate-demographic dividendLatviaLeast developed countries: UN classificationLebanonLesothoLiberiaLibyaLiechtensteinLow incomeLower middle incomeLuxembourgMacao SAR, ChinaMadagascarMalawiMalaysiaMaldivesMaliMaltaMarshall IslandsMauritaniaMauritiusMexicoMiddle East & North AfricaMiddle East & North Africa (excluding high income)Middle East & North Africa (IDA & IBRD countries)MonacoMontenegroMoroccoMozambiqueMyanmarNamibiaNepalNetherlandsNicaraguaNigerNigeriaNorwayOmanOther small statesPacific island small statesPakistanPanamaPapua New GuineaParaguayPeruPhilippinesPolandPortugalPre-demographic dividendQatarRwandaSamoaSan MarinoSao Tome and PrincipeSaudi ArabiaSenegalSeychellesSierra LeoneSingaporeSloveniaSolomon IslandsSouth AfricaSouth AsiaSouth Asia (IDA & IBRD)SpainSri LankaSt. Kitts and NevisSt. LuciaSt. Vincent and the GrenadinesSub-Saharan Africa Sub-Saharan Africa (excluding high income)Sub-Saharan Africa (IDA & IBRD countries)SudanSurinameSwazilandSwedenSwitzerlandSyrian Arab RepublicTanzaniaThailandTimor-LesteTogoTongaTrinidad and TobagoTunisiaTurkeyTuvaluUgandaUnited Arab EmiratesUpper middle incomeUruguayVanuatuVenezuela, RBVietnamYemen, Rep.ZambiaZimbabwe Timeline:
This timeline shows a graph from 1983 to 2014 of Cabo Verde. No data until 1982. Number of actual observations by date: 19.
Source name:
World Development Indicators
Source organization:
UNESCO Institute for Statistics
Categories, topics:
Education
Last updated:
apr 23, 2017
Indicators value changes by year
Maximum:
93.619
jan 1, 2013
At the date of observation
Value
Absolute change
Change from previous value
jan 1, 1983
32.08
+32.08
0.0%
jan 1, 1984
40.267
+8.187
25.52%
jan 1, 1986
35.856
-4.41
-10.95%
jan 1, 1987
47.377
+11.52
32.13%
jan 1, 1988
43.925
-3.451
-7.29%
jan 1, 1989
45.102
+1.177
2.68%
jan 1, 1995
61.315
+16.213
35.95%
jan 1, 2002
91.795
+30.479
49.71%
jan 1, 2003
87.154
-4.64
-5.06%
jan 1, 2004
90.943
+3.789
4.35%
jan 1, 2005
89.642
-1.3
-1.43%
jan 1, 2006
90.465
+0.822
0.92%
jan 1, 2007
89.694
-0.771
-0.85%
jan 1, 2008
89.669
-0.025
-0.03%
jan 1, 2009
87.888
-1.78
-1.99%
jan 1, 2010
88.375
+0.487
0.55%
jan 1, 2011
92.148
+3.773
4.27%
jan 1, 2013
93.619
+1.471
1.6%
jan 1, 2014
92.759
-0.86
-0.92%
Ranking of countries by current statistics by years


Comments: