29
/
en
AIzaSyAYiBZKx7MnpbEhh9jyipgxe19OcubqV5w
April 1, 2024
95567
Burkina Faso
BFA
true
2
1
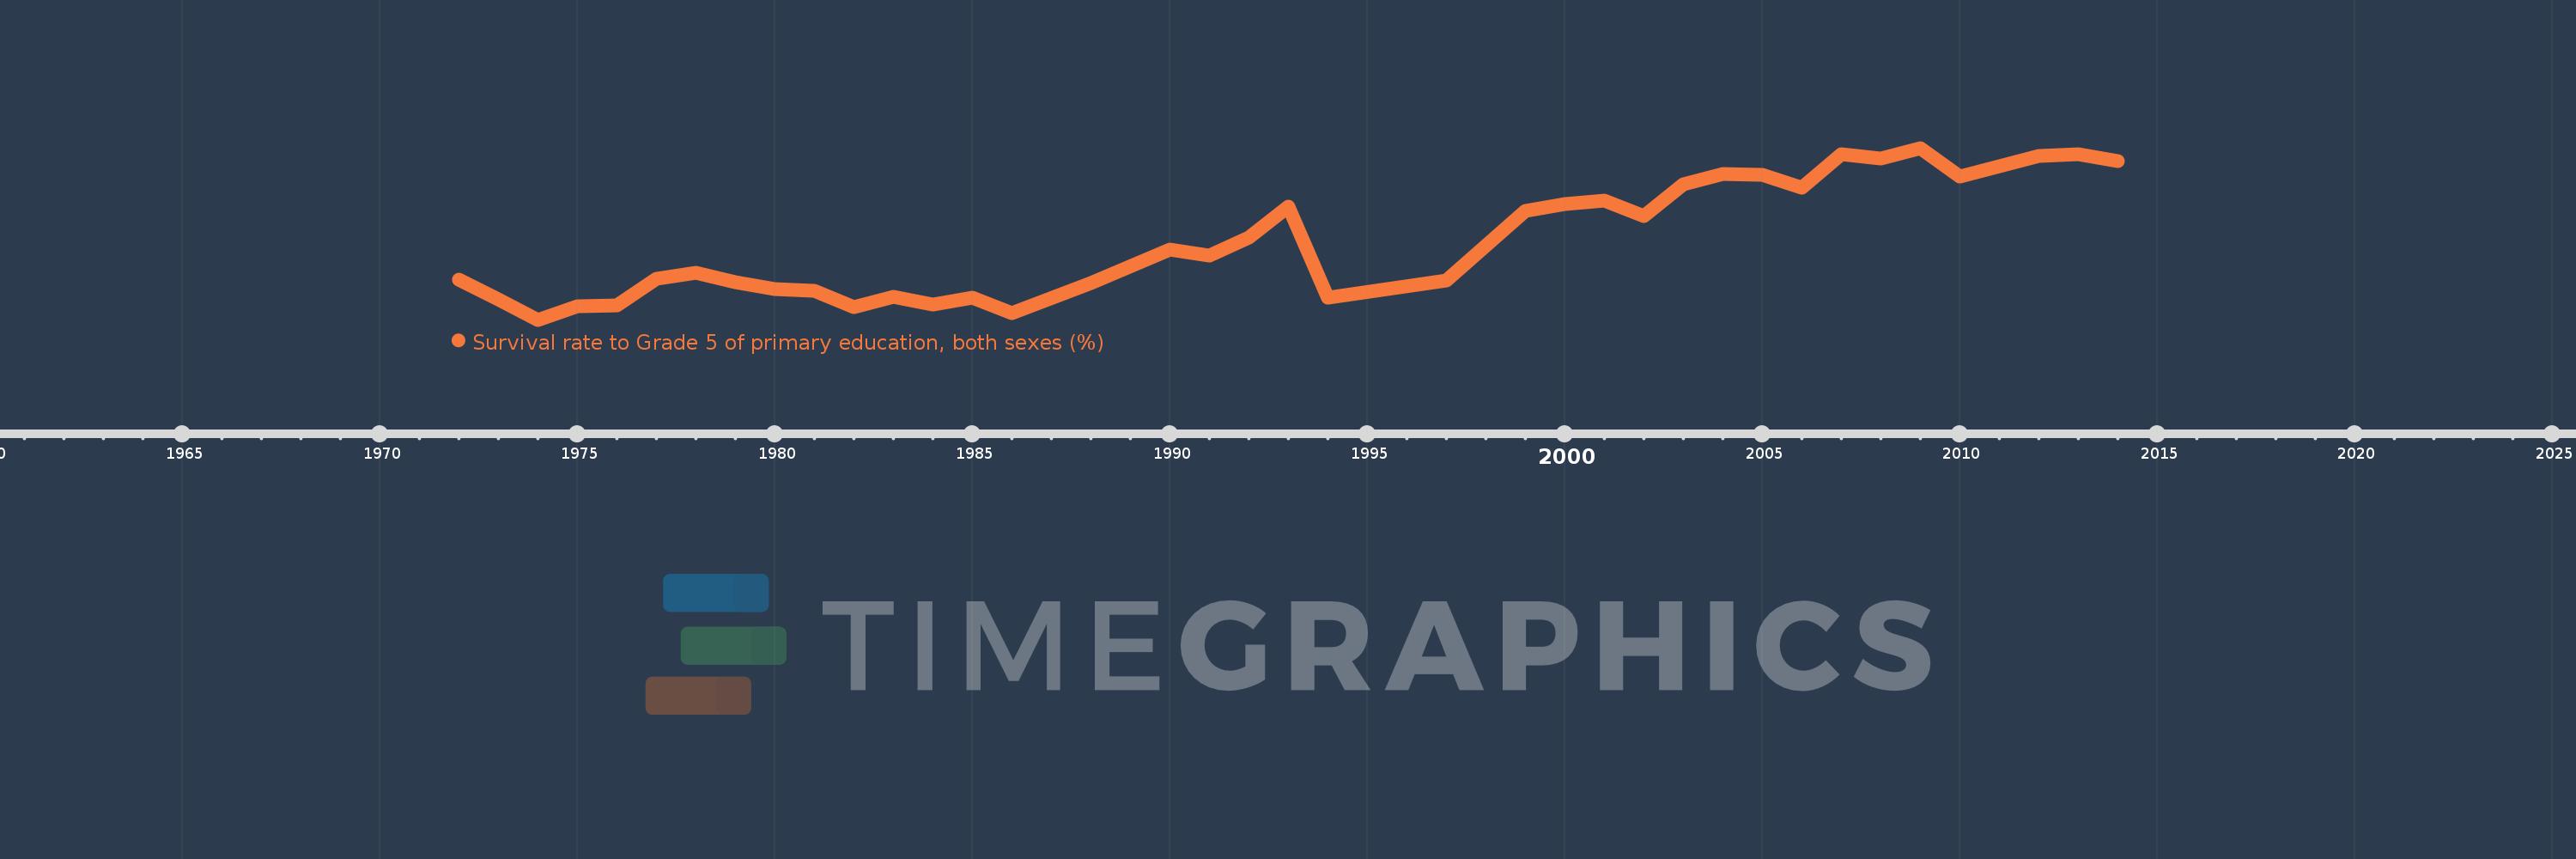
Survival rate to Grade 5 of primary education, both sexes (%)
2014,2013,2012,2010,2009,2008,2007,2006,2005,2004,2003,2002,2001,2000,1999,1997,1994,1993,1992,1991,1990,1988,1986,1985,1984,1983,1982,1981,1980,1979,1978,1977,1976,1975,1974,1973,1972
This statistics in other country:
AfghanistanAlbaniaAlgeriaAndorraAngolaAntigua and BarbudaArab WorldArgentinaArubaBahamas, TheBahrainBangladeshBarbadosBelarusBelgiumBelizeBeninBermudaBhutanBoliviaBosnia and HerzegovinaBotswanaBritish Virgin IslandsBrunei DarussalamBurkina FasoBurundiCabo VerdeCambodiaCameroonCanadaCaribbean small statesCayman IslandsCentral African RepublicChadChileChinaColombiaComorosCongo, Dem. Rep.Congo, Rep.Costa RicaCote d'IvoireCubaCyprusCzech RepublicDenmarkDjiboutiDominicaDominican RepublicEarly-demographic dividendEast Asia & PacificEast Asia & Pacific (excluding high income)East Asia & Pacific (IDA & IBRD countries)EcuadorEgypt, Arab Rep.El SalvadorEquatorial GuineaEritreaEstoniaEthiopiaFijiFinlandFranceGabonGambia, TheGeorgiaGhanaGreeceGrenadaGuatemalaGuineaGuinea-BissauGuyanaHaitiHeavily indebted poor countries (HIPC)HondurasHong Kong SAR, ChinaHungaryIBRD onlyIcelandIDA blendIDA onlyIDA totalIndiaIndonesiaIran, Islamic Rep.IraqIrelandIsraelItalyJamaicaJapanJordanKenyaKiribatiKorea, Rep.KuwaitLao PDRLate-demographic dividendLatviaLeast developed countries: UN classificationLebanonLesothoLiberiaLibyaLiechtensteinLow incomeLower middle incomeLuxembourgMacao SAR, ChinaMadagascarMalawiMalaysiaMaldivesMaliMaltaMarshall IslandsMauritaniaMauritiusMexicoMiddle East & North AfricaMiddle East & North Africa (excluding high income)Middle East & North Africa (IDA & IBRD countries)MonacoMontenegroMoroccoMozambiqueMyanmarNamibiaNepalNetherlandsNicaraguaNigerNigeriaNorwayOmanOther small statesPacific island small statesPakistanPanamaPapua New GuineaParaguayPeruPhilippinesPolandPortugalPre-demographic dividendQatarRwandaSamoaSan MarinoSao Tome and PrincipeSaudi ArabiaSenegalSeychellesSierra LeoneSingaporeSloveniaSolomon IslandsSouth AfricaSouth AsiaSouth Asia (IDA & IBRD)SpainSri LankaSt. Kitts and NevisSt. LuciaSt. Vincent and the GrenadinesSub-Saharan Africa Sub-Saharan Africa (excluding high income)Sub-Saharan Africa (IDA & IBRD countries)SudanSurinameSwazilandSwedenSwitzerlandSyrian Arab RepublicTanzaniaThailandTimor-LesteTogoTongaTrinidad and TobagoTunisiaTurkeyTuvaluUgandaUnited Arab EmiratesUpper middle incomeUruguayVanuatuVenezuela, RBVietnamYemen, Rep.ZambiaZimbabwe Timeline:
This timeline shows a graph from 1972 to 2014 of Burkina Faso. No data until 1971. Number of actual observations by date: 37.
Source name:
World Development Indicators
Source organization:
UNESCO Institute for Statistics
Categories, topics:
Education
Last updated:
apr 23, 2017
Indicators value changes by year
Minimum:
39.753
jan 1, 1974
Maximum:
82.227
jan 1, 2009
At the date of observation
Value
Absolute change
Change from previous value
jan 1, 1972
49.62
+49.62
0.0%
jan 1, 1973
44.777
-4.843
-9.76%
jan 1, 1974
39.753
-5.024
-11.22%
jan 1, 1975
43.013
+3.26
8.2%
jan 1, 1976
43.283
+0.27
0.63%
jan 1, 1977
49.962
+6.679
15.43%
jan 1, 1978
51.331
+1.37
2.74%
jan 1, 1979
49.023
-2.309
-4.5%
jan 1, 1980
47.407
-1.615
-3.3%
jan 1, 1981
46.847
-0.56
-1.18%
jan 1, 1982
42.828
-4.019
-8.58%
jan 1, 1983
45.485
+2.657
6.21%
jan 1, 1984
43.425
-2.06
-4.53%
jan 1, 1985
45.176
+1.751
4.03%
jan 1, 1986
41.352
-3.824
-8.47%
jan 1, 1988
48.716
+7.364
17.81%
jan 1, 1990
57.07
+8.354
17.15%
jan 1, 1991
55.597
-1.473
-2.58%
jan 1, 1992
59.988
+4.391
7.9%
jan 1, 1993
67.807
+7.818
13.03%
jan 1, 1994
45.276
-22.531
-33.23%
jan 1, 1997
49.453
+4.177
9.23%
jan 1, 1999
66.706
+17.253
34.89%
jan 1, 2000
68.3
+1.594
2.39%
jan 1, 2001
69.135
+0.835
1.22%
jan 1, 2002
65.387
-3.748
-5.42%
jan 1, 2003
73.16
+7.772
11.89%
jan 1, 2004
75.854
+2.694
3.68%
jan 1, 2005
75.512
-0.342
-0.45%
jan 1, 2006
72.49
-3.022
-4.0%
jan 1, 2007
80.578
+8.089
11.16%
jan 1, 2008
79.61
-0.968
-1.2%
jan 1, 2009
82.227
+2.617
3.29%
jan 1, 2010
75.089
-7.138
-8.68%
jan 1, 2012
80.306
+5.217
6.95%
jan 1, 2013
80.714
+0.408
0.51%
jan 1, 2014
79.051
-1.663
-2.06%
Ranking of countries by current statistics by years


Comments: