29
/
en
AIzaSyAYiBZKx7MnpbEhh9jyipgxe19OcubqV5w
April 1, 2024
146356
Guinea
GIN
true
2
1
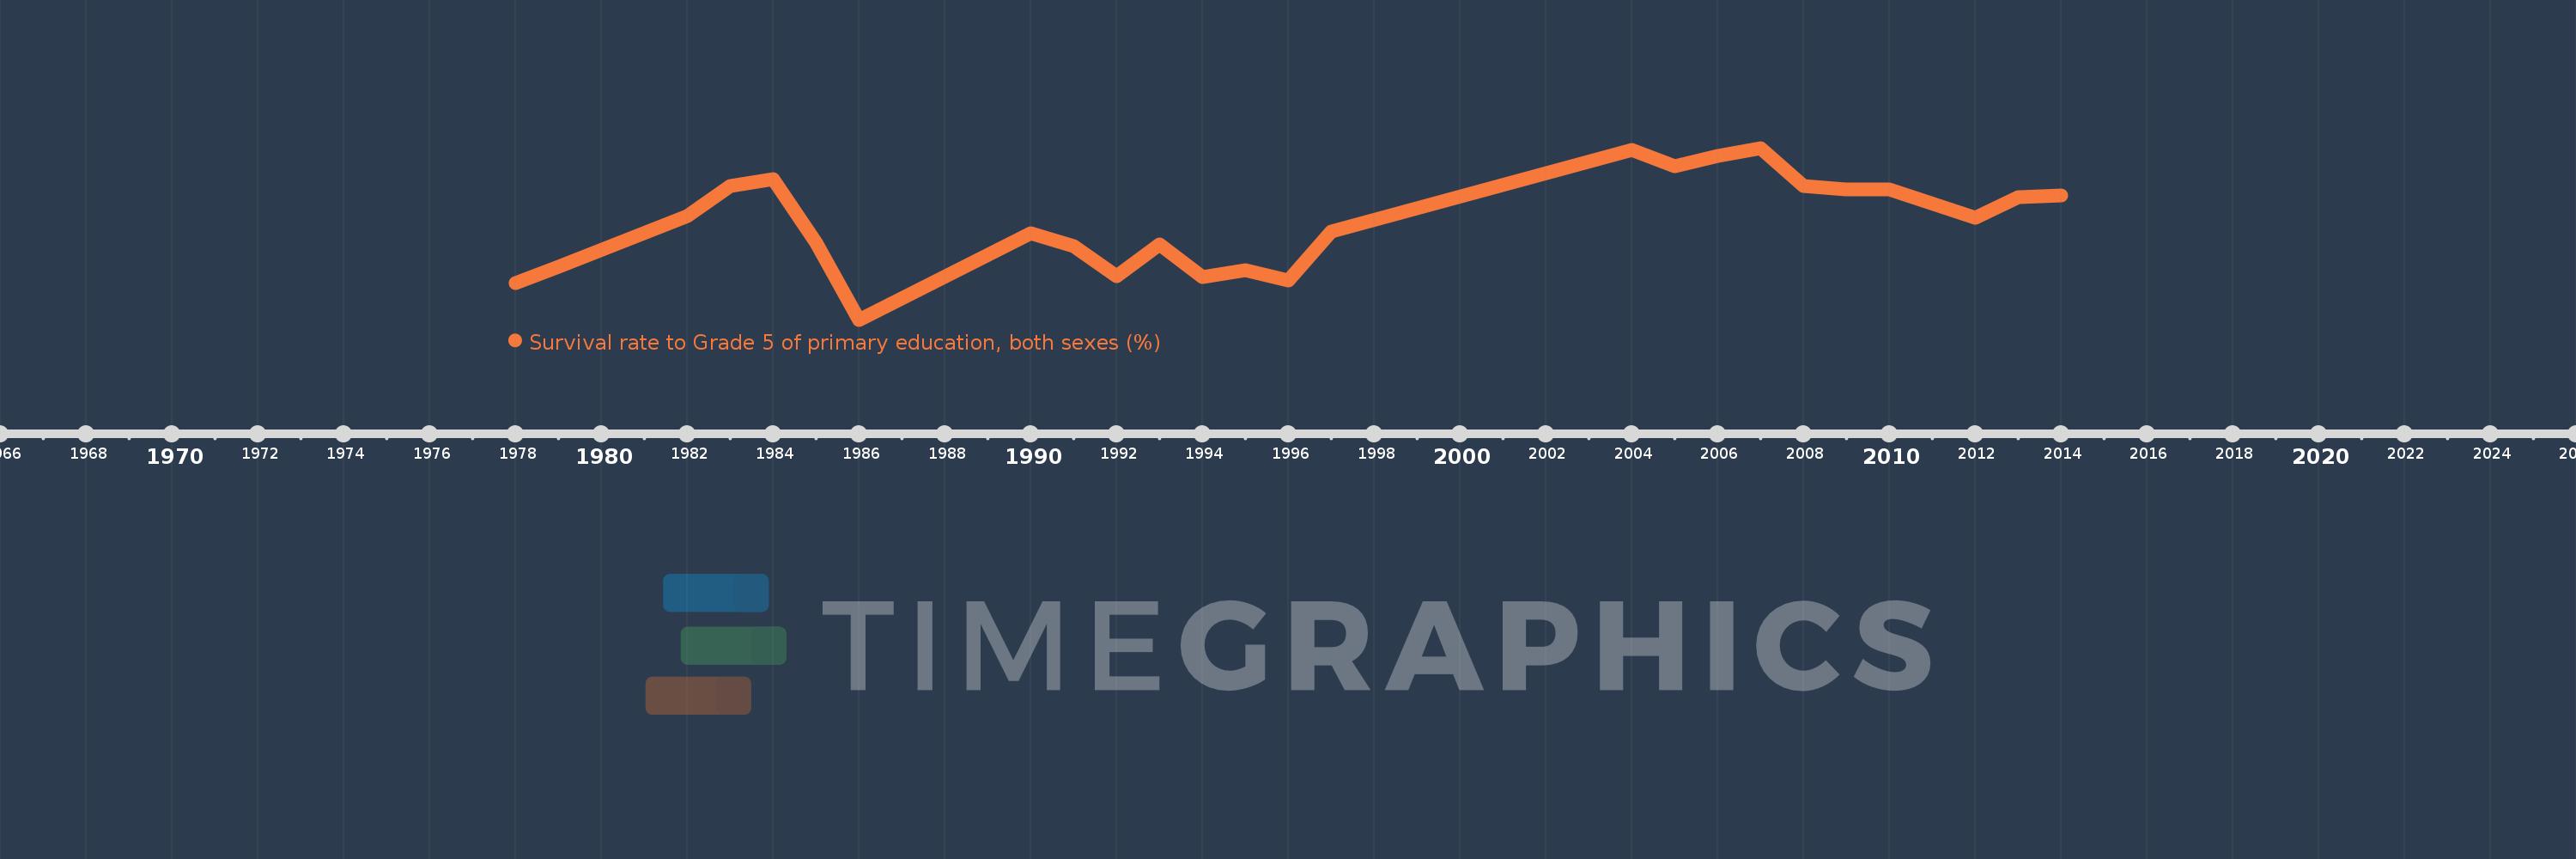
Survival rate to Grade 5 of primary education, both sexes (%)
2014,2013,2012,2010,2009,2008,2007,2006,2005,2004,1997,1996,1995,1994,1993,1992,1991,1990,1986,1985,1984,1983,1982,1979,1978
This statistics in other country:
AfghanistanAlbaniaAlgeriaAndorraAngolaAntigua and BarbudaArab WorldArgentinaArubaBahamas, TheBahrainBangladeshBarbadosBelarusBelgiumBelizeBeninBermudaBhutanBoliviaBosnia and HerzegovinaBotswanaBritish Virgin IslandsBrunei DarussalamBurkina FasoBurundiCabo VerdeCambodiaCameroonCanadaCaribbean small statesCayman IslandsCentral African RepublicChadChileChinaColombiaComorosCongo, Dem. Rep.Congo, Rep.Costa RicaCote d'IvoireCubaCyprusCzech RepublicDenmarkDjiboutiDominicaDominican RepublicEarly-demographic dividendEast Asia & PacificEast Asia & Pacific (excluding high income)East Asia & Pacific (IDA & IBRD countries)EcuadorEgypt, Arab Rep.El SalvadorEquatorial GuineaEritreaEstoniaEthiopiaFijiFinlandFranceGabonGambia, TheGeorgiaGhanaGreeceGrenadaGuatemalaGuineaGuinea-BissauGuyanaHaitiHeavily indebted poor countries (HIPC)HondurasHong Kong SAR, ChinaHungaryIBRD onlyIcelandIDA blendIDA onlyIDA totalIndiaIndonesiaIran, Islamic Rep.IraqIrelandIsraelItalyJamaicaJapanJordanKenyaKiribatiKorea, Rep.KuwaitLao PDRLate-demographic dividendLatviaLeast developed countries: UN classificationLebanonLesothoLiberiaLibyaLiechtensteinLow incomeLower middle incomeLuxembourgMacao SAR, ChinaMadagascarMalawiMalaysiaMaldivesMaliMaltaMarshall IslandsMauritaniaMauritiusMexicoMiddle East & North AfricaMiddle East & North Africa (excluding high income)Middle East & North Africa (IDA & IBRD countries)MonacoMontenegroMoroccoMozambiqueMyanmarNamibiaNepalNetherlandsNicaraguaNigerNigeriaNorwayOmanOther small statesPacific island small statesPakistanPanamaPapua New GuineaParaguayPeruPhilippinesPolandPortugalPre-demographic dividendQatarRwandaSamoaSan MarinoSao Tome and PrincipeSaudi ArabiaSenegalSeychellesSierra LeoneSingaporeSloveniaSolomon IslandsSouth AfricaSouth AsiaSouth Asia (IDA & IBRD)SpainSri LankaSt. Kitts and NevisSt. LuciaSt. Vincent and the GrenadinesSub-Saharan Africa Sub-Saharan Africa (excluding high income)Sub-Saharan Africa (IDA & IBRD countries)SudanSurinameSwazilandSwedenSwitzerlandSyrian Arab RepublicTanzaniaThailandTimor-LesteTogoTongaTrinidad and TobagoTunisiaTurkeyTuvaluUgandaUnited Arab EmiratesUpper middle incomeUruguayVanuatuVenezuela, RBVietnamYemen, Rep.ZambiaZimbabwe Timeline:
This timeline shows a graph from 1978 to 2014 of Guinea. No data until 1977. Number of actual observations by date: 25.
Source name:
World Development Indicators
Source organization:
UNESCO Institute for Statistics
Categories, topics:
Education
Last updated:
apr 23, 2017
Indicators value changes by year
Minimum:
26.649
jan 1, 1986
Maximum:
81.854
jan 1, 2007
At the date of observation
Value
Absolute change
Change from previous value
jan 1, 1978
38.488
+38.488
0.0%
jan 1, 1979
43.597
+5.109
13.27%
jan 1, 1982
59.916
+16.318
37.43%
jan 1, 1983
69.585
+9.67
16.14%
jan 1, 1984
71.84
+2.255
3.24%
jan 1, 1985
51.315
-20.526
-28.57%
jan 1, 1986
26.649
-24.666
-48.07%
jan 1, 1990
54.373
+27.724
104.03%
jan 1, 1991
50.276
-4.097
-7.53%
jan 1, 1992
40.74
-9.536
-18.97%
jan 1, 1993
50.855
+10.114
24.83%
jan 1, 1994
40.281
-10.574
-20.79%
jan 1, 1995
42.618
+2.337
5.8%
jan 1, 1996
39.344
-3.274
-7.68%
jan 1, 1997
55.08
+15.736
40.0%
jan 1, 2004
81.294
+26.215
47.59%
jan 1, 2005
75.935
-5.36
-6.59%
jan 1, 2006
79.218
+3.283
4.32%
jan 1, 2007
81.854
+2.636
3.33%
jan 1, 2008
69.702
-12.151
-14.85%
jan 1, 2009
68.57
-1.132
-1.62%
jan 1, 2010
68.579
+0.008
0.01%
jan 1, 2012
59.512
-9.066
-13.22%
jan 1, 2013
66.123
+6.611
11.11%
jan 1, 2014
66.595
+0.472
0.71%
Ranking of countries by current statistics by years


Comments: