29
/
en
AIzaSyAYiBZKx7MnpbEhh9jyipgxe19OcubqV5w
April 1, 2024
180961
Lithuania
LTU
true
2
1
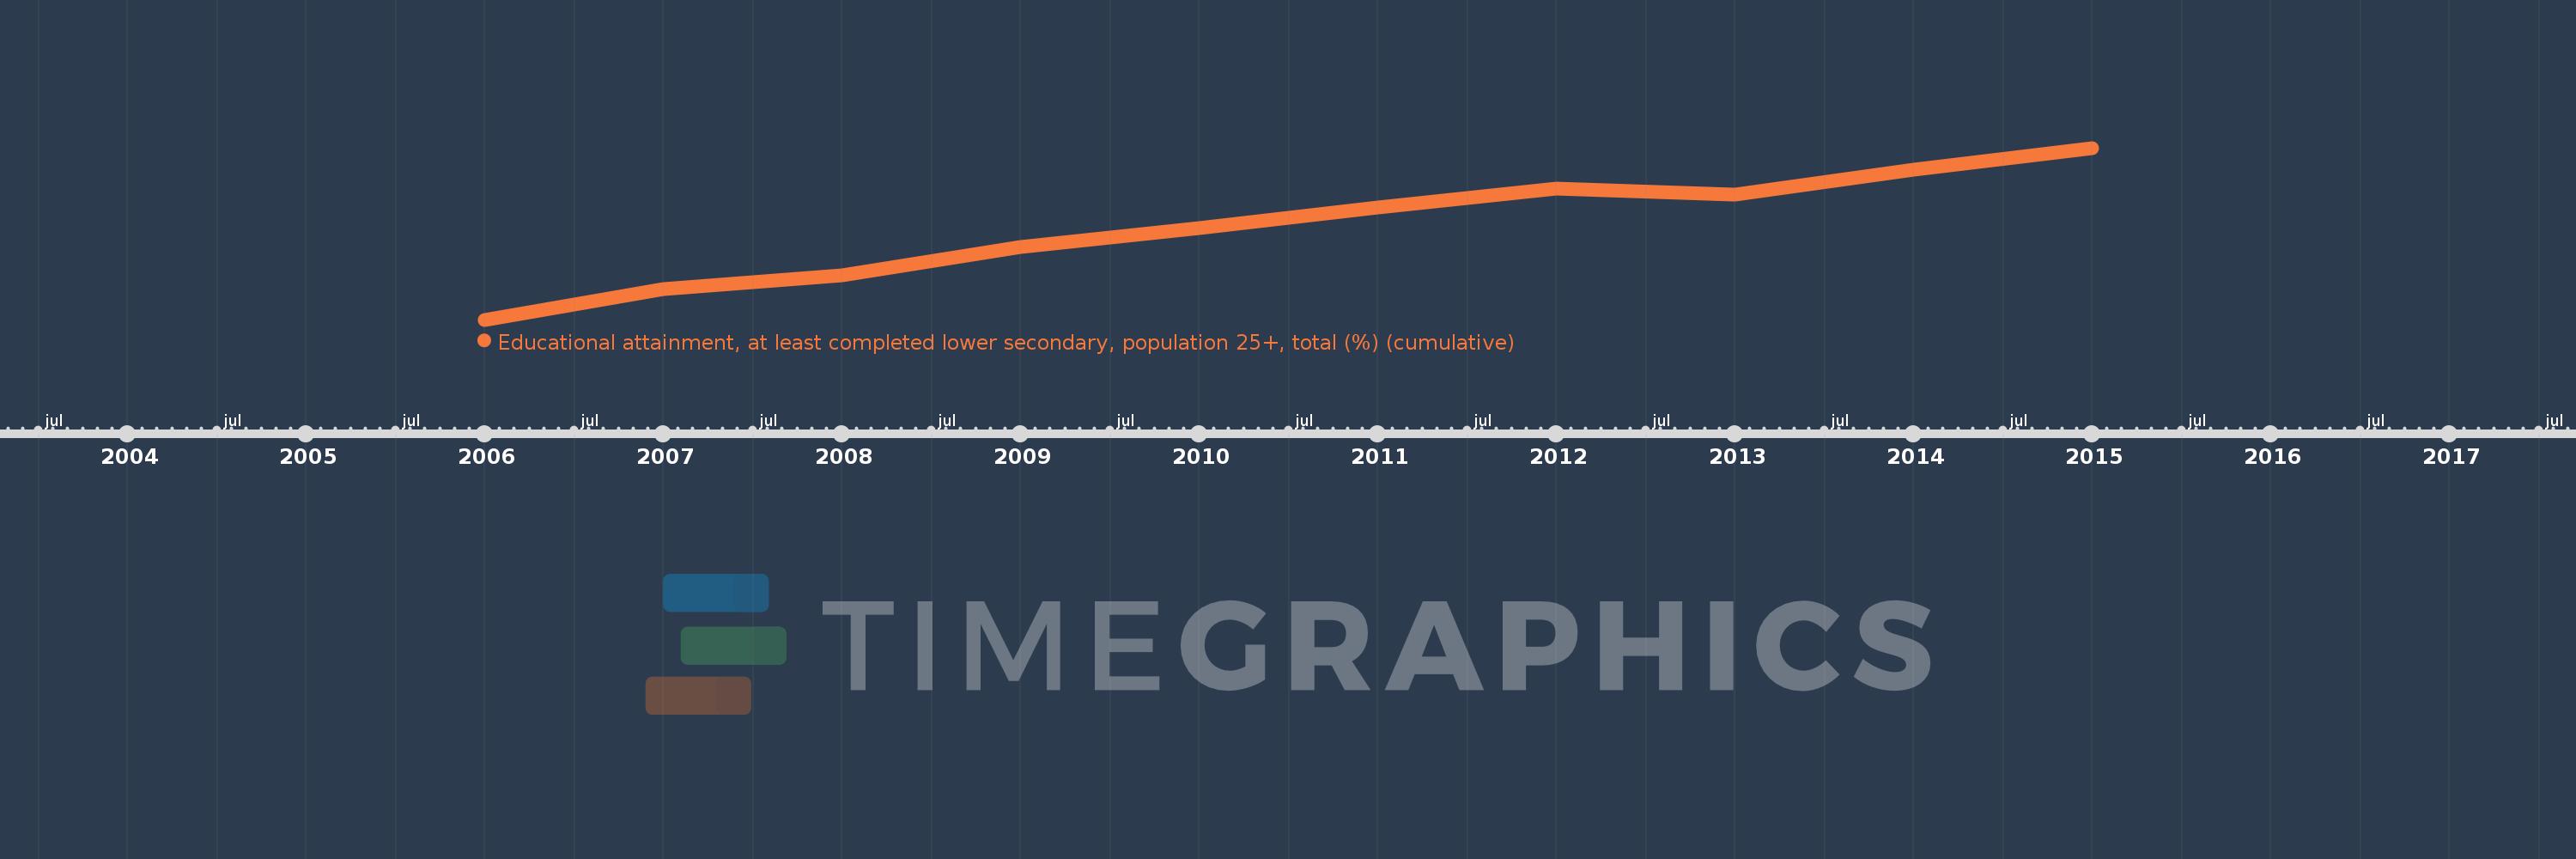
Educational attainment, at least completed lower secondary, population 25+, total (%) (cumulative)
2015,2014,2013,2012,2011,2010,2009,2008,2007,2006
This statistics in other country:
Timeline:
This timeline shows a graph from 2006 to 2015 of Lithuania. No data until 2005. Number of actual observations by date: 10.
Source name:
World Development Indicators
Source organization:
United Nations Educational, Scientific, and Cultural Organization (UNESCO) Institute for Statistics.
Categories, topics:
Education, Gender
Last updated:
apr 23, 2017
Indicators value changes by year
Maximum:
93.064
jan 1, 2015
At the date of observation
Value
Absolute change
Change from previous value
jan 1, 2006
86.98
+86.98
0.0%
jan 1, 2007
88.07
+1.09
1.25%
jan 1, 2008
88.557
+0.486
0.55%
jan 1, 2009
89.562
+1.005
1.14%
jan 1, 2010
90.241
+0.679
0.76%
jan 1, 2011
90.96
+0.719
0.8%
jan 1, 2012
91.634
+0.675
0.74%
jan 1, 2013
91.415
-0.219
-0.24%
jan 1, 2014
92.289
+0.874
0.96%
jan 1, 2015
93.064
+0.775
0.84%
Ranking of countries by current statistics by years


Comments: