29
/
en
AIzaSyAYiBZKx7MnpbEhh9jyipgxe19OcubqV5w
April 1, 2024
225766
Portugal
PRT
true
2
1
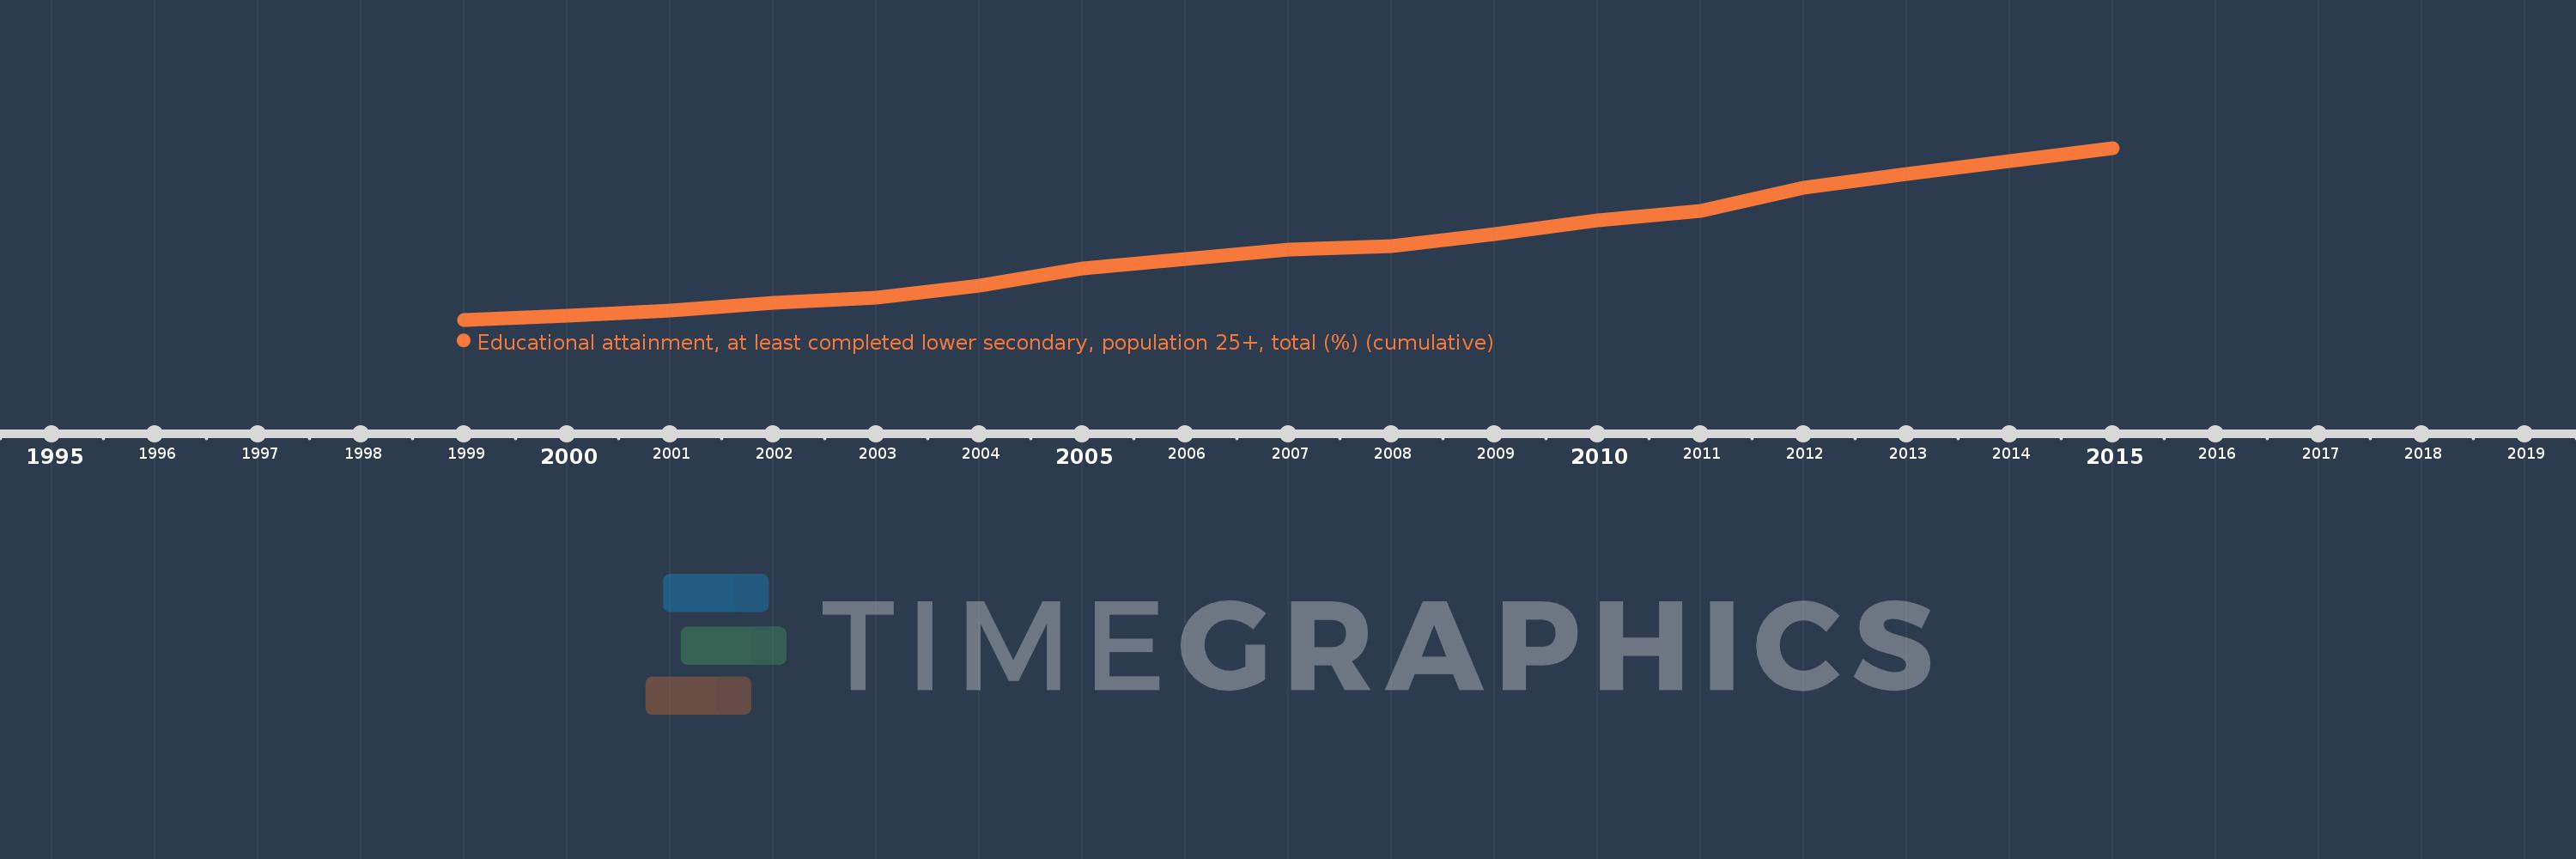
Educational attainment, at least completed lower secondary, population 25+, total (%) (cumulative)
2015,2014,2013,2012,2011,2010,2009,2008,2007,2006,2005,2004,2003,2002,2001,2000,1999
This statistics in other country:
Timeline:
This timeline shows a graph from 1999 to 2015 of Portugal. No data until 1998. Number of actual observations by date: 17.
Source name:
World Development Indicators
Source organization:
United Nations Educational, Scientific, and Cultural Organization (UNESCO) Institute for Statistics.
Categories, topics:
Education, Gender
Last updated:
apr 23, 2017
Indicators value changes by year
Maximum:
51.445
jan 1, 2015
At the date of observation
Value
Absolute change
Change from previous value
jan 1, 1999
23.64
+23.64
0.0%
jan 1, 2000
24.3
+0.66
2.79%
jan 1, 2001
25.13
+0.83
3.41%
jan 1, 2002
26.328
+1.199
4.77%
jan 1, 2003
27.218
+0.89
3.38%
jan 1, 2004
29.214
+1.995
7.33%
jan 1, 2005
31.899
+2.685
9.19%
jan 1, 2006
33.447
+1.548
4.85%
jan 1, 2007
34.994
+1.547
4.63%
jan 1, 2008
35.546
+0.552
1.58%
jan 1, 2009
37.546
+2.0
5.63%
jan 1, 2010
39.664
+2.118
5.64%
jan 1, 2011
41.303
+1.638
4.13%
jan 1, 2012
45.007
+3.705
8.97%
jan 1, 2013
47.23
+2.223
4.94%
jan 1, 2014
49.285
+2.055
4.35%
jan 1, 2015
51.445
+2.16
4.38%
Ranking of countries by current statistics by years


Comments: