29
/
en
AIzaSyAYiBZKx7MnpbEhh9jyipgxe19OcubqV5w
April 1, 2024
222036
Peru
PER
true
2
1
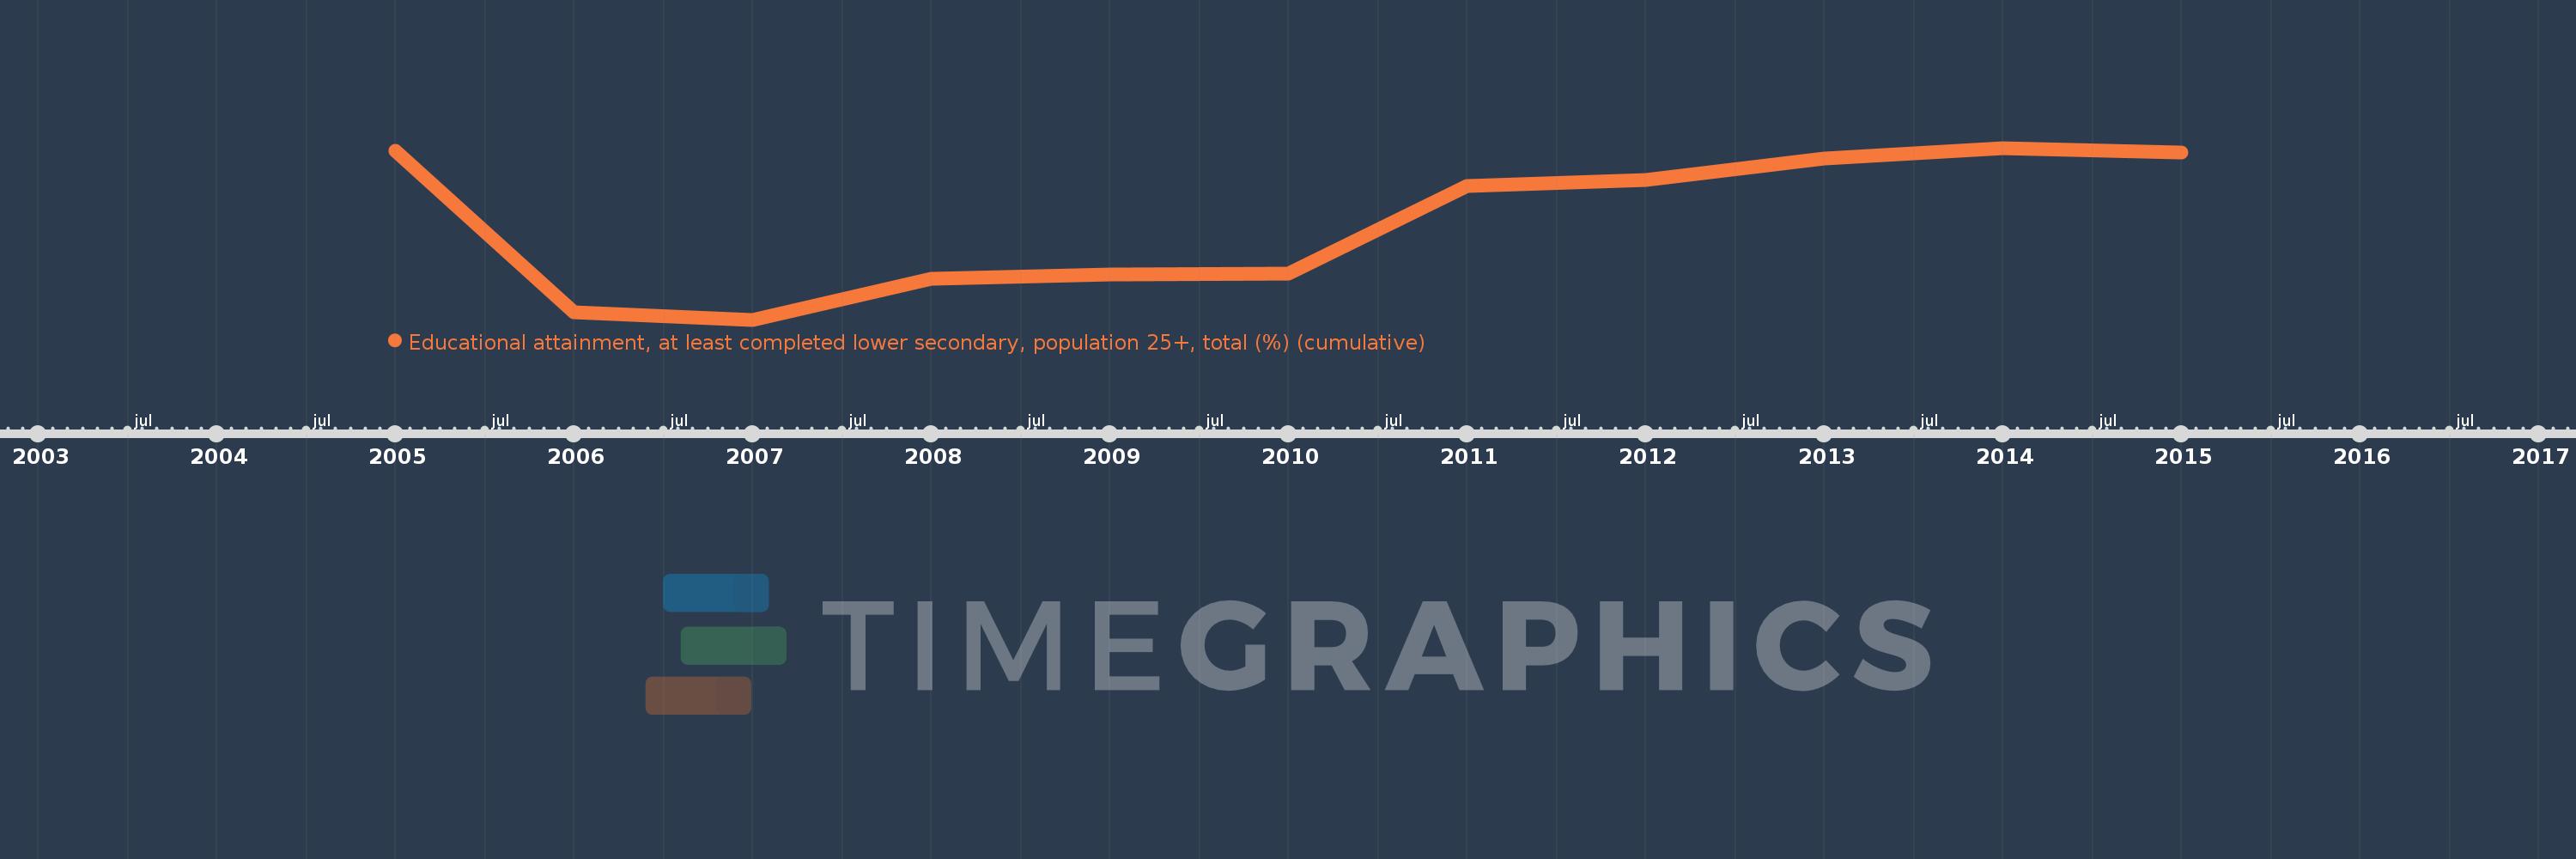
Educational attainment, at least completed lower secondary, population 25+, total (%) (cumulative)
2015,2014,2013,2012,2011,2010,2009,2008,2007,2006,2005
This statistics in other country:
Timeline:
This timeline shows a graph from 2005 to 2015 of Peru. No data until 2004. Number of actual observations by date: 11.
Source name:
World Development Indicators
Source organization:
United Nations Educational, Scientific, and Cultural Organization (UNESCO) Institute for Statistics.
Categories, topics:
Education, Gender
Last updated:
apr 23, 2017
Indicators value changes by year
Minimum:
49.676
jan 1, 2007
Maximum:
61.896
jan 1, 2014
At the date of observation
Value
Absolute change
Change from previous value
jan 1, 2005
61.679
+61.679
0.0%
jan 1, 2006
50.221
-11.458
-18.58%
jan 1, 2007
49.676
-0.545
-1.08%
jan 1, 2008
52.609
+2.932
5.9%
jan 1, 2009
52.888
+0.279
0.53%
jan 1, 2010
52.956
+0.068
0.13%
jan 1, 2011
59.177
+6.222
11.75%
jan 1, 2012
59.601
+0.423
0.72%
jan 1, 2013
61.139
+1.538
2.58%
jan 1, 2014
61.896
+0.757
1.24%
jan 1, 2015
61.578
-0.318
-0.51%
Ranking of countries by current statistics by years


Comments: